More Network dashboards
| This page is currently a work in progress; expect frequent near-term updates. |
Web Center
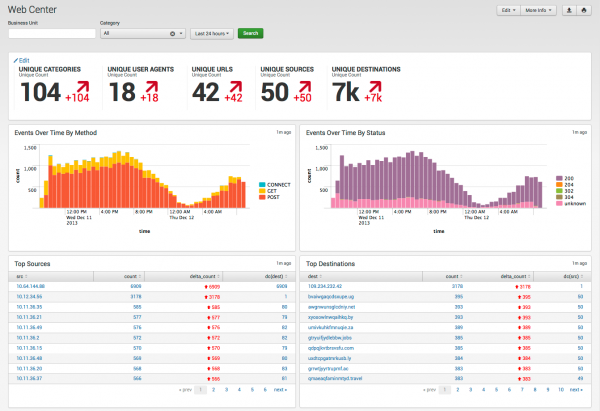
Use the Web Center dashboard to profile web traffic events in your deployment. This dashboard reports on web traffic gathered by Splunk from proxy servers. It is useful for troubleshooting potential issues such as excessive bandwidth usage or proxies that are no longer serving content for proxy clients. The Web Center can also be used to profile the type of content that clients are requesting and how much bandwidth is being used by each client.
Use the filtering options at the top of the screen to limit which items are shown. Configure new data inputs through Splunk Settings or search for particular traffic events directly through Incident Review.
Click chart elements or table rows to display the raw events for the data represented. See dashboard drilldown for more information.
This table describes the panels on the dashboard.
| Panel | Description |
|---|---|
| Dashboard filter | Restricts the view on the current dashboard to events that match the selected criteria. Selections apply to the current dashboard only. These filters are available:
See descriptions of the standard filter options. |
| Key Indicators | |
| Events Over Time by Method | Shows the total number of proxy events over time, aggregated by one of the following:
Spikes in traffic may indicate suspicious activity; dips may indicate network connection problems. |
| Events Over Time by Status | |
| Top Sources | Sources associated with the highest volume of network traffic. This is useful for identifying sources that are using an excessive amount of network traffic (for example, hosts doing file-sharing), or frequently-requested destinations generating large amounts of network traffic (for example, YouTube or Pandora). |
| Top Destinations | Destinations associated with the highest volume of network traffic. This is useful for identifying sources that are using an excessive amount of network traffic (for example, hosts doing file-sharing), or frequently-requested destinations generating large amounts of network traffic (for example, YouTube or Pandora). |
Note: Text values in search fields must be lowercase text.
Configuration Information
For information about how to configure the Web Center, see "Web Center dashboard" in the Splunk App for Enterprise Security Installation and Configuration Manual.
Web Search
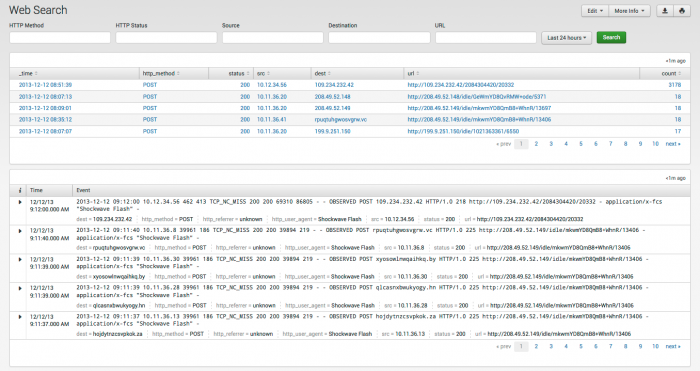
Use the Web Search dashboard to search for web events that are of interest.
Click chart elements or table rows to display the raw events for the data represented. See dashboard drilldown for more information.
This table describes the panels on the dashboard.
| Panel | Description |
|---|---|
| Dashboard filter | Restricts the view on the current dashboard to events that match the selected criteria. Selections apply to the current dashboard only. These filters are available:
|
| Search results (events) |
Configuration Information
For information about how to configure the Web Search dashboard, see "Web Search dashboard" in the Splunk App for Enterprise Security Installation and Configuration Manual.
Network Changes
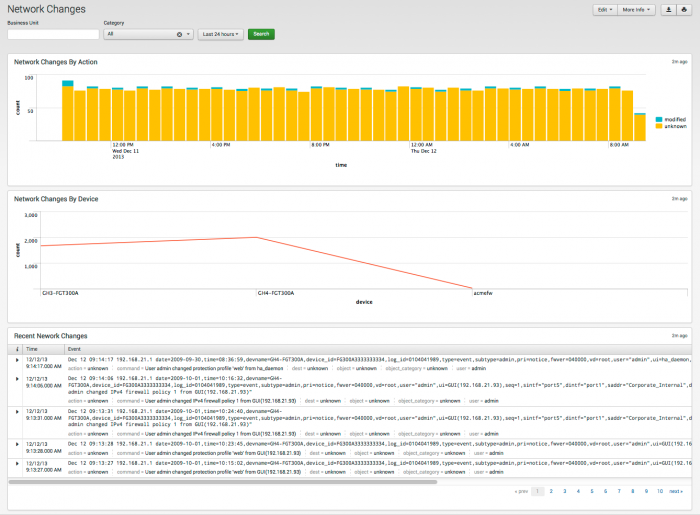
Use the Network Changes dashboard to track configuration changes to firewalls and other network devices in your environment. This dashboard helps to troubleshoot device problems; frequently, when firewalls or other devices go down, this is due to a recent configuration change on the device(s).
Click chart elements or table rows to display the raw events for the data represented. See dashboard drilldown for more information.
This table describes the panels on the dashboard.
| Panel | Description |
|---|---|
| Dashboard filter | Restricts the view on the current dashboard to events that match the selected criteria. Selections apply to the current dashboard only. These filters are available:
|
| Network Changes By Action | |
| Network Changes By Device | |
| Search results (events) |
Configuration Information
For information about how to configure the Network Changes dashboard, see "Network Changes" in the Splunk App for Enterprise Security Installation and Configuration Manual.
| Network dashboards | Identity dashboards |
This documentation applies to the following versions of Splunk® Enterprise Security: 3.1, 3.1.1


 Download manual
Feedback submitted, thanks!