Investigation Timelines
Track your investigations into security incidents on an investigation timeline. This tool allows you to visualize and document the progression of an incident and the steps you take during your investigation. Add notable events, Splunk events, and add information from your investigator journal, which logs items in your action history.

Start an investigation
You can start a new investigation from anywhere within Enterprise Security.
- Start an investigation from Incident Review while triaging notable events.
- Start an investigation when viewing a dashboard or a configuration using the Investigation Bar. See Investigation Bar in this manual.
- Start an investigation from My Investigations.
- Start an investigation with an event workflow action. See Add a notable or Splunk event.
Track an investigation
Track the progress of your investigation of an attack, or plot the timeline of the attack itself. As you conduct your investigation using Splunk Enterprise Security, you can add notable events or Splunk events that add insight to the investigation timeline. Add searches, suppression filters, and dashboard views to the timeline from your action history. See Your action history.
Record other important investigation steps that you take, like phone, email, or chat conversations as notes on the timeline. You can also use the notes feature to add other relevant information like links to online press coverage, tweets, or stored screenshots.
Add a notable or Splunk event
You can add a notable event to an investigation timeline from the Actions menu on the Incident Review dashboard.
Add a Splunk event to an investigation from any dashboard that displays source events, or after using the drilldown to view source events.
- Expand an event to see the Event Actions menu and other details.
- Click Event Actions and select Add to Investigation.
- A new tab will open. Select from existing investigations, or create a new one.
- Click Save.
Add an item from your action history
When viewing a timeline:
- Click Create New Entry and select Action History.
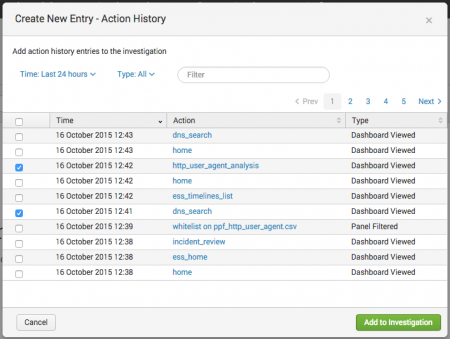
- Locate the actions that you want to add to the investigation timeline.
- The most recent actions that you've taken display in the action history dialog box. You can only add items from your own action history.
- Sort by time, or filter by action type (search run, dashboard viewed, panel filtered, notable status change, or notable events suppressed).
- For search items, ensure that you are adding the correct search by hovering your mouse over a search action to view the entire search string, or the search ID if no search string is available.
- Select the checkbox next to the item or items that you want to add to the investigation timeline.
- Click Add to Investigation.

See "Your action history" for more detail.
Add a note
Add a note to an investigation when viewing the timeline.
- Click Create New Entry and select Note.
- Choose from existing notes, or click Create a New Note to make a new note.
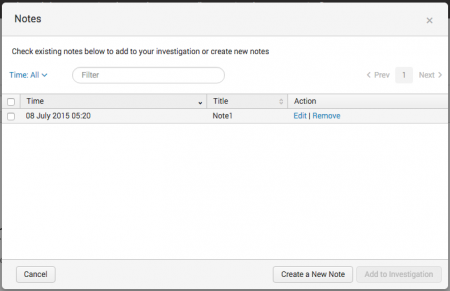
- Add a Title, Time, and a Description.
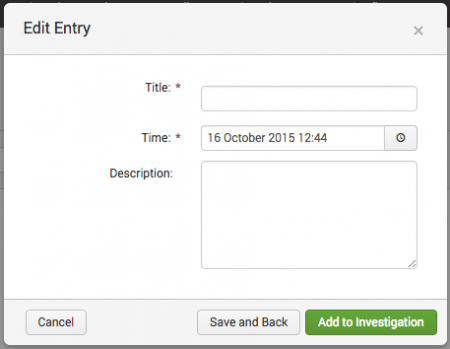
For example, a note to record a phone conversation may include:- Title: "Phone Conversation with Police"
- Time: When the phone call took place. Defaults to the current date and time.
- Description: Notes from the call including the phone number, person you spoke with, and what you spoke about. Include any relevant URLs, such as a pointer to the location of a conversation recording or a screenshot you shared.
- Click Add to Investigation.


If you're in the middle of multiple investigations, you can create a note and click Save and Back to save it without adding it to the investigation you're currently viewing.
Add entries using the investigation bar
You can add new notes and items from your action history to an investigation timeline from any dashboard in Splunk Enterprise Security. If you are in the middle of an investigation, you can add something to a timeline using the investigation bar visible at the bottom of each page. See Investigation Bar in this manual.
Modify timeline entries
Modify the entries on a timeline by clicking the list button to view the timeline as a chronological list of entries.

Edit or remove individual entries.
- Locate the timeline entry you want to modify.
- In the Actions column, click Edit or Remove.
Remove multiple entries.
- Select the checkbox next to the entries you want to remove.
- Click Edit Selection and select Remove.
Collaborate with another investigator
In many cases you will need to collaborate with another investigator on an investigation timeline. This enables you to track the same investigation in one place, though many people may be working on it.
Add a collaborator to an investigation timeline.
- Click the plus icon

- Type their name and select them from the drop-down list to add them.
- Their initials will appear in a circle to confirm that they were added. For example, an analyst named Douglas Alan Denon is listed as "DA", while an analyst named Tricia Thompson is "TT".

You can add any Splunk user as a collaborator, and owners and collaborators have the same permissions.
View the collaborators assigned to an investigation.

- Hover your mouse over the collaborator icons to see their names. If a person does not have a name listed in Splunk, their username will display instead.
- Investigation owners will display Owner next to their name. For example, "Tricia Thompson (Owner)".
To remove someone, hover your mouse over their circle and click the x that appears.
Review an investigation
Revisit past investigations, or view a current investigation by clicking the title from the Investigation Bar or from My Investigations. Click an entry to see all details associated with it.

Gain greater insight into a particularly active attack or investigation, or see a big-picture view of an investigation, by expanding or contracting the timeline.

Click the timeline to move the timeline and scan the entries. View a chronological list of all timeline entries by clicking the list icon, or refine your view of the timeline using filters.
| Filter by | Description | Action |
|---|---|---|
| Type | View only entries of the selected type. | Drop-down. Select to filter by |
| Title | Type a value from the title of a timeline in the text box to view only matching timelines. | Text field. Empty by default. Filters as you type. |
To share an investigation with someone outside of Splunk Enterprise Security, such as for auditing purposes, you can print any timeline or save it as a PDF.
- From the timeline, navigate to File > Print in your web browser.
- Splunk ES will generate a formatted version of the timeline with entries in chronological order. Print the timeline investigation, or save it as a PDF using the print dialog.
Example investigation workflow
- You are notified of a security incident that needs investigation, whether through a notable event, an alert action, or another means such as an email, ticket from the help desk, or a phone call.
- Create an investigation in Splunk Enterprise Security.
- If you need to work with someone else on the investigation, add them as a collaborator to the investigation.
- Investigate the incident. As you investigate, add helpful or insightful steps to the investigation timeline.
- Perform searches, adding helpful searches to the timeline from your action history with the investigation bar or relevant events to the timeline using event actions. This makes it easy to replicate your work for future, similar investigations, and to provide a comprehensive record of your investigation process.
- Filter dashboards to focus on specific elements, like narrowing down a swimlane search to focus on a specific asset or identity on the asset or identity investigator dashboards. Add insightful filtering actions from your action history to the timeline using the investigation bar.
- Triage and investigate related notable events. Add relevant notable events to the timeline.
- Add notes to record other important investigation steps, like notes from a phone call, email or chat conversations, links to press coverage or social media posts, and links to important screenshots.
Your action history
As you investigate an attack or other security incident, actions that you take in Splunk Enterprise Security are recorded in your investigator journal as action history items so that you can add them to an investigation timeline. Only you can view items in your action history. Once you add an item to an investigation timeline, all collaborators on the timeline can view that item. The investigator journal records items in your action history, keeping a log of your actions.
Your investigator journal tracks the following types of actions using saved searches.
- Dashboards you visit.
- Searches you run.
- Per-panel filtering actions you take.
- Changes you make to a notable event.
- Suppression filters you add to a notable event.
See Data sources for investigations in this manual.
Splunk ES tracks these actions to help you add context to an investigation timeline, better audit an investigation, and provide a complete history of actions taken during an investigation that resulted in relevant findings. For example, if you perform a search that provides helpful information for an investigation, you can add that search to the investigation timeline. You can then locate that search string within the investigation timeline, run the search again, or revisit a helpful search to set it up as a report after the investigation is over.
| Configure correlation searches | My Investigations |
This documentation applies to the following versions of Splunk® Enterprise Security: 4.0.0, 4.0.1, 4.0.2, 4.0.3, 4.0.4, 4.0.5, 4.0.6
Feedback submitted, thanks!