Extreme Search
Extreme search enhances the Splunk platform search language. As implemented in Splunk Enterprise Security, you can use the Extreme search commands to:
- Build dynamic thresholds based on event data.
- Provide context awareness by replacing event counts with natural language.
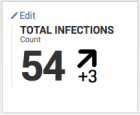
For example, in the Enterprise Security Malware Center dashboard, the Key Security Indicator Total Infections displays the total number of systems with malware infections over the last 48 hours.
Splunk ES determines the displayed rate of change by comparing the current count of infections against the count of infected systems from the day before. There is no automatic determination of a normal daily range for infected systems in your environment. The threshold is entirely user-configured. Infections have increased by three, but the value has no context to indicate whether it is a notable increase.
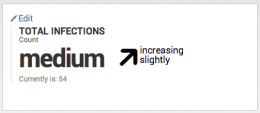
The same indicator using Extreme search displays the relevant information, but includes a depth of information that was not available with the default Total Infections indicator.
Using Extreme Search, Splunk ES calculates the infection count and rate of new infections using a dynamically-updating model. The key security indicator uses contextual and easy-to-understand language. In this case, you know that the total malware infection count is not higher than it would be any other day, and the rate of change in infections is not alarming.
The use of context and concept in Extreme search
The core ideas of context and concept are critical to the understanding of Extreme search. These ideas are responsible for the data model used for dynamic thresholds by an Extreme search command.
- Context: A context defines a relationship to a field or data in numerical terms. The data to be modeled must be represented by numerical values as the result of a search. Example contexts include total network throughput over the last 24 hours or network latency over the last 24 hours.
- Concept: A term that applies to data, representing a qualitative rather than quantitative description. Example concepts include the terms "extreme," "high," "medium," "low," and "minimal".
By combining context and concept, Extreme search adds meaning and value to the data.
- The total network throughput over the last 24 hours was Extreme, high, medium, low, or minimal.
- The network latency over the last 24 hours was extreme, high, medium, low, or minimal.
The concept terms describe network activity in both examples, but have different meanings based on the context they are applied to. If your environment reports that total network throughput is minimal, it is a warning. If the environment reports that network latency is minimal, the network is operating normally.
Data models and Extreme search
After you choose a context and concept to represent your data, Splunk ES creates a data model. Using the Extreme search commands, the data model maps the context and event statistics by concept. Extreme search commands refer to this combined model as a context.
Saved searches update contexts, such as the dynamic threshold context. The saved search searches event data for statistics to update the context. For a list of the saved searches that update contexts, see Containers, contexts, and saved searches in this topic.
Configuring Extreme search for Enterprise Security
The use of Extreme search commands in Enterprise Security requires no additional configuration. The default installation of ES provides all contexts used by the Extreme search commands and enables the saved searches that maintain them.
- For a list of the contexts and saved searches implemented in Enterprise Security, see Containers, contexts, and saved searches in this topic.
- For a list of the key security indicators that use Extreme search, see Extreme Search Key Security Indicators in this topic.
- For a list of the correlation searches that use Extreme search, see Extreme Search Correlation searches in this topic. All correlation searches are disabled by default.
Extreme Search Correlation searches
All correlation searches in Enterprise Security are disabled by default. See Enable the correlation searches in this manual.
Guided Search Creation is not available for correlation searches that use Extreme search commands. These correlation searches use Extreme search.
| Search Name | Context |
|---|---|
| Brute Force Access Behavior Detected | failures_by_src_count_1h |
| Brute Force Access Behavior Detected Over One Day | failures_by_src_count_1d |
| Abnormally High Number of Endpoint Changes By User | change_count_by_user_by_change_type_1d |
| Host Sending Excessive Email | recipients_by_src_1h |
| Substantial Increase in Events | count_by_signature_1h |
| Substantial Increase in Port Activity | count_by_dest_port_1d |
| Unusual Volume of Network Activity | count_30m |
| Abnormally High Number of HTTP Method Events By Src | count_by_http_method_by_src_1d |
Extreme Search Key Security Indicators
You can easily identify the key indicators that use Extreme search by their use of semantic language instead of numerical values. The key security indicators on each dashboard are enabled by default.
| Search Name | Contexts |
|---|---|
| Access - Total Access Attempts | authentication: count_1d, percentile |
| Malware - Total Infection Count | malware: count_1d, percentile |
| Risk - Median Risk Score | median_object_risk_by_object_type_1d, percentile |
| Risk - Median Risk Score By System | median_object_risk_by_object_type_1d, percentile |
| Risk - Median Risk Score By User | median_object_risk_by_object_type_1d, percentile |
| Risk - Median Risk Score By Other | median_object_risk_by_object_type_1d, percentile |
| Risk - Aggregated Risk | total_risk_by_object_type_1d, percentile |
| Risk - Aggregated System Risk | total_risk_by_object_type_1d, percentile |
| Risk - Aggregated User Risk | total_risk_by_object_type_1d, percentile |
| Risk - Aggregated Other Risk | total_risk_by_object_type_1d, percentile |
Containers, contexts, and saved searches
Enterprise Security stores contexts in objects called containers. A container is both an object in the file system and a logical configuration used to classify contexts. In Enterprise Security, the containers are files with the .context extension. A container can contain multiple contexts. You can view the saved searches that generate contexts on the Content Management page in Enterprise Security.
Note: Enterprise Security enables the dynamic context saved searches by default.
| Container name | Context name | App location | Dynamic context search name |
|---|---|---|---|
| authentication | failures_by_src_count_1h | SA-AccessProtection | Access - Authentication Failures By Source - Context Gen |
| failures_by_src_count_1d | Access - Authentication Failures By Source Per Day - Context Gen | ||
| count_1d | Access - Authentication Volume Per Day - Context Gen | ||
| change_analysis | change_count_by_user_by_change_type_1d | SA-EndpointProtection | Change - Total Change Count By User By Change Type Per Day - Context Gen |
| destinations_by_src_1h | SA-EndpointProtection | Endpoint - Emails By Destination Count - Context Gen | |
| recipients_by_src_1h | Endpoint - Emails By Source - Context Gen | ||
| malware | count_1d | SA-NetworkProtection | Endpoint - Malware Daily Count - Context Gen |
| ids_attacks | count_by_signature_1h | SA-NetworkProtection | Network - Event Count By Signature Per Hour - Context Gen |
| network_traffic | count_by_dest_port_1d | SA-NetworkProtection | Network - Port Activity By Destination Port - Context Gen |
| src_count_30m | Network - Traffic Source Count Per 30m - Context Gen | ||
| count_30m | Network - Traffic Volume Per 30m - Context Gen | ||
| web | count_by_http_method_by_src_1d | SA-NetworkProtection | Web - Web Event Count By Src By HTTP Method Per 1d - Context Gen |
| risk | median_object_risk_by_object_type_1d | SA-ThreatIntelligence | Risk - Median Object Risk Per Day - Context Gen |
| total_risk_by_object_type_1d | Risk - Total Risk By Risk Object Type Per Day - Context Gen | ||
| default | percentile | SA-Utils | ESS - Percentile - Context Gen |
| default | height | Splunk_SA_ExtremeSearch | None. |
| trendchange | None. | ||
| compatibility | None. |
Examples
For an extended walkthrough on a correlation search that implements Extreme search commands, see An Extreme search example in this manual.
| Dashboard requirements matrix | An Extreme search example |
This documentation applies to the following versions of Splunk® Enterprise Security: 4.1.0, 4.1.1, 4.1.2, 4.1.3, 4.1.4, 4.2.0 Cloud only, 4.2.1 Cloud only, 4.2.2 Cloud only, 4.5.0, 4.5.1, 4.5.2, 4.5.3, 4.6.0 Cloud only


 Download manual
Feedback submitted, thanks!