Key indicators
Splunk Enterprise Security includes predefined key indicators that identify key security metrics for the security domains covered by Splunk ES. You can view the key indicators on dashboards in Splunk Enterprise Security, or add them to custom glass tables as security metrics.
Key indicators provide a visual reference for several security metrics. Key indicator searches populate the security metrics of key indicators.The key indicator searches run against the data models defined in Enterprise Security, or the data models defined in the Common Information Model app. Some key indicator searches run against the count of notable events.
Key indicators on dashboards
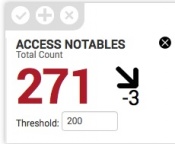
On dashboards, each key indicator includes a value indicator, a trend amount, a trend indicator, and a threshold value used to indicate the importance or priority of the indicator. The key indicator searches default to running over a relative time span of 48 hours.

| Field | Description |
|---|---|
| Description | Brief description of the security-related metric. |
| Value indicator | Current count of events. If a threshold is set, the numbers will change color as they cross thresholds. Click the value indicator to drill down into the key indicator search and view the raw events. If the value indicator is wrong, such as a percentage value greater than 100%, there could be missing or wrong data in the data model dataset used by the key indicator search to calculate a value. |
| Trend amount | Displays the change in event count over the time period defined in the key indicator search. |
| Trend indicator | Displays a directional arrow to indicate the direction of the trend. The arrow changes color and direction over time. |
Edit key indicators on dashboards
Enterprise Security includes preconfigured key indicators. Each dashboard key indicator row includes an editor that allows simple, visual changes to be made directly to the key indicators without leaving the dashboard. You can make changes to the search generating the key indicator on the Content Management dashboard. See Edit a key indicator search.
- Click the Edit pencil icon to the top left of the indicator bar. The editing tools display above the indicators.
- Drag and drop the indicators to rearrange them. There can be 5 indicators per row, and multiple indicator rows.
- Click the checkmark icon to save.

Remove key indicators from a dashboard
Remove a key indicator from a dashboard.
- Click the Edit pencil icon to the top left of the indicator bar. The editing tools display above the indicators.
- Click the X to the top right of the indicator.
- Click the checkmark icon to save.
Removing the indicator from a dashboard does not remove the key indicator from Enterprise Security.
Add key indicators to a dashboard
Add key indicators to a dashboard.
- Click the Edit pencil icon to the top left of the indicator bar. The editing tools display above the indicators.
- Click the plus icon to open the Add indicators panel.
- Click the checkmark icon to save.
Set a threshold for a key indicator on a dashboard
You can set a threshold for a key indicator on a dashboard to change the color of the key indicator. A threshold defines an acceptable value for the event count of an indicator. An event count above the threshold causes the key indicator to display as red, while an event count below the threshold causes the key indicator to display as green. If the threshold is undefined, the event count remains black.
- Click the Edit pencil icon to the top left of the indicator bar. The editing tools display above the indicators.
- Type a Threshold for the key indicator.
- Click the checkmark icon to save.
Configuring key indicator searches
Configure key indicator searches on Content Management in Splunk Enterprise Security. Use the filters to select a type of key indicator to view only key indicator searches.
Schedule a key indicator search
Key indicators included with Splunk Enterprise Security use data model acceleration. Enable acceleration and schedule the search to run as a scheduled report. Scheduled report results are cached, allowing the indicator to display results on the dashboard more quickly.
- Select Configure > Content Management.
- Locate the key indicator search that you want to accelerate.
- Click Accelerate in the Actions column.
- In the Edit Acceleration window, select the Accelerate check box.
- Select a Refresh Frequency for how often Enterprise Security should update the cached results.
- Click Save.
After a key indicator is accelerated, the Next Scheduled Time populates on the Content Management page and the lightning bolt for that indicator changes from grey to yellow.
Edit a key indicator search
Make changes to a key indicator search.
- From the ES menu bar, select Configure > Content Management
- Select a key indicator search.
- (Optional) Change the search name.
- (Optional) Change the destination app where the search is stored.
- (Optional) Change the title of the key indicator. The title appears above the key indicator on a dashboard, or next to the security metric on a glass table.
- (Optional) Change the sub-title of the key indicator that is used to describe the type of the key indicator function on dashboards.
- (Optional) Change the search string that populates the key indicator.
- (Optional) Add a drilldown URL such as a custom search or dashboard link to override the default drilldown behavior. By default, the key indicator drilldown opens the search results that produced the key indicator value. For key indicators on glass tables, you can set a custom drilldown when you add the key indicator to the glass table.
- (Optional) Select the Schedule check box to enable acceleration for a key indicator and allow it to load faster on a dashboard.
- (Optional) Change the Cron Schedule frequency using standard cron notation.
- (Optional) Change the Threshold behavior to determine the color assigned to the value indicator. By default, no threshold produces a black value indicator, a threshold number higher than the count of a value indicator produces a green value indicator, and a threshold number lower than the count of a value indicator produces a red value indicator.
- (Optional) Add a Value suffix to describe the value indicator. For example, specify units. On dashboards, the value suffix appears between the value indicator and the trend indicator.
- (Optional) Select the Invert check box to change the default colors of the trend indicator threshold. If this check box is selected, a threshold number higher than the count of a value indicator produces a red value indicator, and a threshold number lower than the count of a value indicator produces a green value indicator.
- Click Save.
Create custom key indicators
| Advanced Filter | Creating new content in Splunk Enterprise Security |
This documentation applies to the following versions of Splunk® Enterprise Security: 4.5.0, 4.5.1, 4.5.2, 4.5.3, 4.6.0 Cloud only
Feedback submitted, thanks!