Create a workbench panel workflow action in Splunk Enterprise Security
Use an embedded workbench as workflow field action to get more context about specific values in Incident Review. The embedded workbench provides a simplified drill-down experience, reduces the number of open tabs, and makes it easier to determine notable event trends. Pre-built panels can be embedded in dashboards and investigations, as well as directly within Incident Review.
Do the following to create a workbench panel workflow action and use an embedded workbench:
- Create a new panel or edit a prebuilt panel
- (Optional) Create a workbench panel from a prebuilt panel
- Create a workflow action
- Click on the field workflow action in Incident Review
- View the embedded workbench
Create a new prebuilt panel or edit a prebuilt panel
Create a new prebuilt panel, or edit of the existing prebuilt panels that ship with Enterprise Security.
Create a prebuilt panel
If you are interested in investigating data that is not already included in a prebuilt panel, you can create your own panel. See Create panels and tabs for the investigation workbench.
Edit an existing prebuilt panel
Editing an existing workbench panel allows you to add tokens to the panel, or view tokens that are already defined. This example starts with editing the existing prebuilt panel of workbench_context_computer_inventory for use in creating the workflow action in the next step.
From the Enterprise Security menu bar, modify the workbench_context_computer_inventory panel by performing the following steps:
- Select Configure > Content > Content Management.
- From the Type filter, select Panel.
- Click the name of the panel, workbench_context_computer_inventory.
- Edit something, such as a token.
The search that is tied to this workbench panel is defined as follows:
<panel>
  <table>
    <search>
      <query>| tstats latest(_time) as _time, latest("All_Inventory.OS.os") as os, latest("All_Inventory.vendor_product") as vendor_product from datamodel="Compute_Inventory"."All_Inventory" where nodename="All_Inventory.OS" ($inventory_asset_dest_filter$ OR $inventory_identity_user_filter$) by "All_Inventory.dest" | head 10000 | `drop_dm_object_name("All_Inventory")` | fields _time, dest, os, vendor_product</query>
    </search>
    <option name="drilldown">cell</option>
    <option name="wrap">false</option>
  </table>
</panel>
You can stack multiple tables or other visualizations inside of the <panel> tags. See panel in the Splunk Enterprise Dashboards and Visualizations.
Create a workbench panel from a prebuilt panel
This step is only required if you create a prebuilt panel in the first step. If you edit an existing prebuilt panel in the first step, then you skip this step.
See Create or modify a panel for the investigation workbench.
Create a workflow action
Create a workflow action that references the workbench panel. This example starts after editing the existing prebuilt panel of workbench_context_computer_inventory as the first step. However, if you create a new prebuilt panel and a new workbench panel, then you can create a workflow action for your workbench panel.
From the Splunk Enterprise menu bar, perform the following steps:
- Go to Settings > Fields > Workflow Actions.
- Click New Workflow Action.
- Type the following in the corresponding fields:
- Name: Use a general name that is saved in workflow_actions.conf, for example,
workbench_computer_inventory. - Label: Use a token in the format of $tokenname$, such as the "dest" field in the notable event. Also append the string "inventory" after the token. For example,
$dest$ Inventory. - Apply only to the following fields: Use an asterisk to apply this to all the fields, for example
*. - Show action in: For displaying in Incident Review, use
Fields menus. - URI: Use the name of the prebuilt-panel that you created or edited, for example, panel=workbench_context_computer_inventory:
/app/$@namespace$/ess_workbench_panel?type_asset=$@field_value$&panel=workbench_context_computer_inventory&drilldown_field=$@field_name$&use_drilldown_time=true
- Name: Use a general name that is saved in workflow_actions.conf, for example,
- Click Save.
The URI is composed of a few special tokens and query parameters:
/app/$@namespace$/ess_workbench_panel?type_asset=$@field_value$&panel=workbench_context_computer_inventory&drilldown_field=$@field_name$&use_drilldown_time=true
Tokens:
| Token | Meaning |
|---|---|
| $@namespace$ | This is the namespace of the app (such as SplunkEnterpriseSecuritySuite) |
| $@field_value$ | This is the value of the field you selected from the workflow action, and is the value set to either type_asset, type_file, type_identity, type_url |
| $@field_name$ | This is the name of the field you selected from the workflow action, and is the value set to drilldown_field for proper telemetry reporting. Has no impact on functionality otherwise. |
Parameters:
| URL query parameter | Optional | Meaning |
|---|---|---|
| type_asset, type_file, type_identity, type_url | Optional, but most panels won't work | Query parameter to pass artifacts; it can also be used/defined multiple times in order to hand over multiple artifacts. Example: ?type_asset=127.0.0.1&type_asset=localhost&type_identity=admin |
| panel | required | Set this to the name of the workbench panel you created. See Create a workflow action. |
| use_drilldown_time | Optional | This defines if on Incident Review the time range defined by the notable event drilldown should be used. Otherwise earliest and latest will be used. |
| drilldown_field | Optional | This is being used for telemetry and indicates on which event field the workflow action is being invoked. |
| earliest | Optional | Timerange to be used for the panel, unless use_drilldown_time is set to true and the workflow action is being called on Incident Review, won't affect the search page. |
| latest | Optional | Timerange to be used for the panel, unless use_drilldown_time is set to true and the workflow action is being called on Incident Review, won't affect the search page. |
For further details about tokens, see Token usage in dashboards in Splunk Enterprise Dashboards and Visualizations.
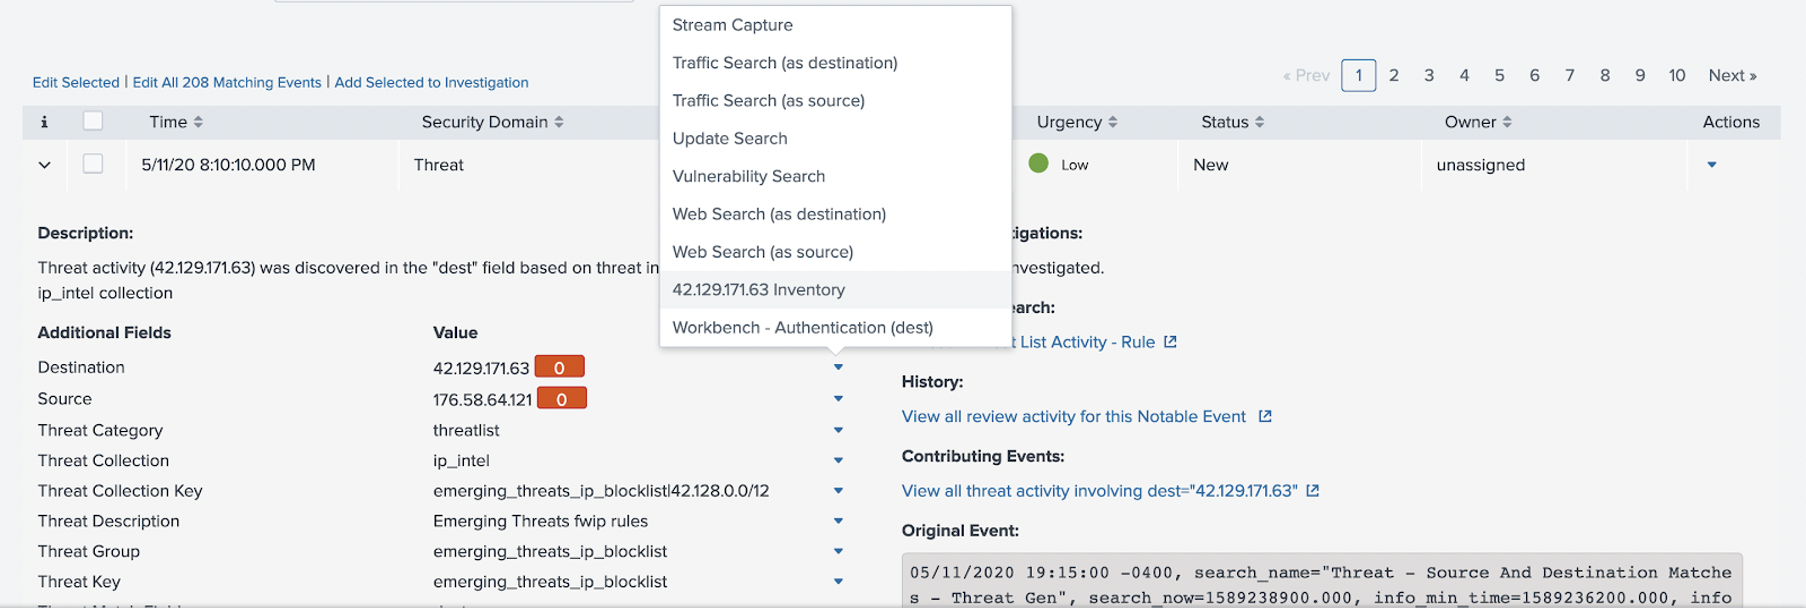
Click on the workflow field action in Incident Review
From the Enterprise Security menu bar, perform the following steps:
- Go to Incident Review.
- From a notable event that contains a Destination (dest) value:
- Click the info drop-down menu to view the event details.
- Click the new workflow in the destination field actions menu, complete with token substitution, such as 42.129.171.63 Inventory.

View the embedded workbench
The embedded workbench pops up with the token passed into it for the artifact. This is the dest field value that you specified when creating the workflow action.
From here, you can drill-down into the data and investigate, without going back to the Enterprise Security menu bar and navigating to Incident Review. See Investigations in Splunk Enterprise Security in Use Splunk Enterprise Security.
You can also use the embedded workbench with an existing default panel. See Example of using the embedded workbench in Use Splunk Enterprise Security.
| Manage and customize investigation statuses in Splunk Enterprise Security | Identify annotations based risk objects in Splunk Enterprise Security |
This documentation applies to the following versions of Splunk® Enterprise Security: 7.0.0
Feedback submitted, thanks!