Display annotations for findings and investigations in Splunk Enterprise Security
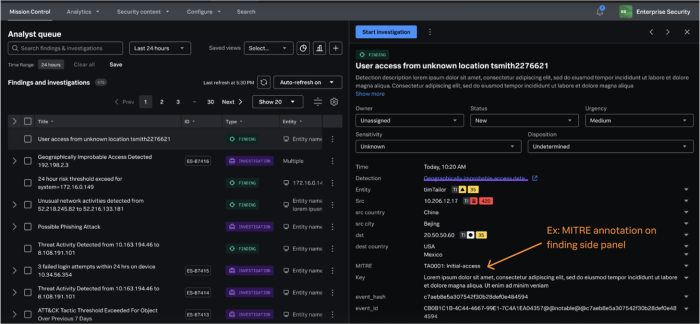
View the annotations associated with findings to help in root cause analysis during the various phases of an investigation. Annotations for findings are displayed in the side panel when you select a finding or an investigation from the analyst queue in the Mission Control page.
Follow these steps to view the annotations for findings and investigations:
- In the Splunk Enterprise Security app, go to the Analyst queue on the Mission Control page to view a list of all findings and investigations.
- Locate the finding for which you want to view the annotations.
- Select the finding to open the details of the finding in the side panel.
- In the side panel, go to the information details to view the annotations.
The following figure shows the MITRE annotations displayed for the finding:
When findings or finding groups become an investigation, the annotations might appear side by side from multiple findings. Additionally, the visualizations such as Risk Timeline and Threat Topology also display the MITRE annotations.
See also
For more information on how to access the risk timeline and the threat topology visualizations, see the product documentation:
| Change the status of a finding or an investigation in Splunk Enterprise Security | Expand tokens in findings in Splunk Enterprise Security |
This documentation applies to the following versions of Splunk® Enterprise Security: 8.0.0, 8.0.1, 8.0.2, 8.0.3, 8.0.31, 8.0.40
 Download manual
Feedback submitted, thanks!