Create adaptive KPI thresholds in ITSI
Adaptive thresholding in IT Service Intelligence (ITSI) uses machine learning techniques to analyze your data and automatically adjust threshold values based on historical data and current conditions. Unlike static thresholds that don't account for changes in your environment, adaptive thresholds account for varying patterns in data over time. Since data patterns can change dramatically, ITSI supports standard deviation, quantile, range-based, and percentage thresholds. The adaptive thresholds automatically recalculate on a nightly basis so that changes in KPI behavior don't trigger false alerts.
By dynamically calculating time-dependent thresholds, adaptive thresholding allows operations to more closely match alerts to the expected workload on an hour-by-hour basis.
Adaptive thresholds are intended to analyze and predict behavior for KPIs only. You currently can't perform adaptive thresholding on a per-entity basis. If you want to perform thresholding at the per-entity level, you must use the standard thresholding procedure. For instructions, see Set per-entity thresholds.
Prerequisites
- You must have the
write_itsi_kpi_threshold_templatecapability to apply adaptive thresholds to a KPI. Theitoa_adminrole is assigned this capability by default. - Before you apply adaptive thresholds, it is best to decide which algorithm you want or need based on the descriptions in Create time-based static KPI thresholds in ITSI.
When to use adaptive thresholds
Consider the following guidelines when deciding whether to enable adaptive thresholding for a KPI:
- Because adaptive thresholding looks for historic patterns in your data, it is best to enable it for KPIs that have established baselines of data points and show a pattern or trend over time.
- Make sure your historic data isn't too random. If the historic data is noisy, a pattern will be difficult to detect.
How are thresholds calculated?
Adaptive thresholds for a KPI are calculated based on the specific KPI that you're previewing. If you like the calculated thresholds, you can save the template and use it. However, if you apply that same template to other KPIs with different ranges of results, such as results in the 0-100 range versus 1000-2000, you won't see immediately useful thresholds. Instead, the preview displays the KPI scores with the thresholds calculated for the original KPI.
To ensure that other KPIs use a threshold template with adaptive thresholding correctly, you can do either of the following:
- Calculate the thresholds for each individual KPI using the template by clicking Apply Adaptive Thresholding. Clicking Apply Adaptive Thresholding assigns the calculation for the statistical policy type you've chosen (such as standard deviation) to the selected KPI and previews the results for you in a graph on the same page. To make the calculation you've previewed part of the threshold template, click Save.
- Apply the template and let the search that runs by default at midnight calculate and update the thresholds. The search updates the KPI's local copy of the threshold template.
Each night at midnight, ITSI recalculates adaptive threshold values for a KPI by organizing the data from the training window into distinct buckets and then analyzing each bucket separately. ITSI creates empty buckets for each time block of the threshold template you select. Each bucket is then populated with all data points from that time block for every day of the training window.
After all the data from the last 7 days is distributed and organized into buckets, ITSI applies the selected algorithm to each bucket of data to calculate the threshold value. For descriptions of each algorithm type, see Create time-based static KPI thresholds in ITSI.
Why aren't thresholds being recalculated?
By default, adaptive thresholds are recalculated each night based on the previous seven days of data. However, you might occasionally see that ITSI fails to recalculate thresholds at midnight, causing health scores to be high or critical because they're out of range. The thresholds are automatically calculated by a search called itsi_at_search_kpi_minus7d that you can run manually if you experience problems.
To run the search manually, perform the following steps:
- Navigate to Settings > Searches, reports, and alerts.
- Locate the itsi_at_search_kpi_minus7d search.
- Click Run.
- If the search fails, decrease the time range to 3600 minutes and re-run the search.
- After the search runs successfully, check the adaptive thresholds in your environment and confirm that they've been recalculated.
You can reapply adaptive threshold settings for a specific KPI by selecting that KPI and then doing the following:
- Click Apply Adaptive Thresholding.
- Click Save.
The itsi_at_search_kpi_minus7d search calculates each individual KPI's adaptive thresholds, not the thresholds in the KPI threshold template.
Performance considerations
Adaptive thresholds are automatically recalculated on a nightly basis so that gradual changes in behavior don't trigger false alerts. Each time a threshold is recalculated, the service must be re-saved into the its_services KV store collection. This process can moderately impact performance. The performance impact increases if a lot of your services contain KPIs with Adaptive Thresholding enabled.
The individual threshold calculations performed for each KPI do not have a significant impact on ITSI performance.
Apply adaptive thresholds to a KPI
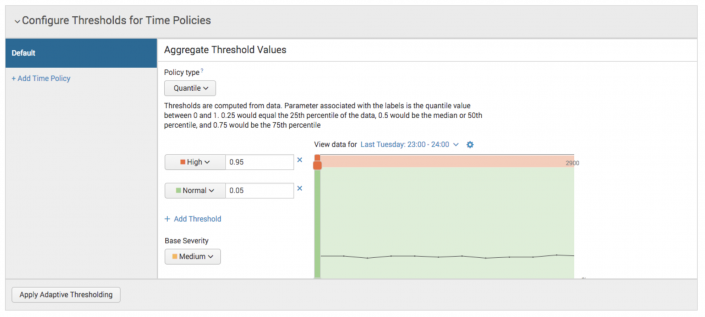
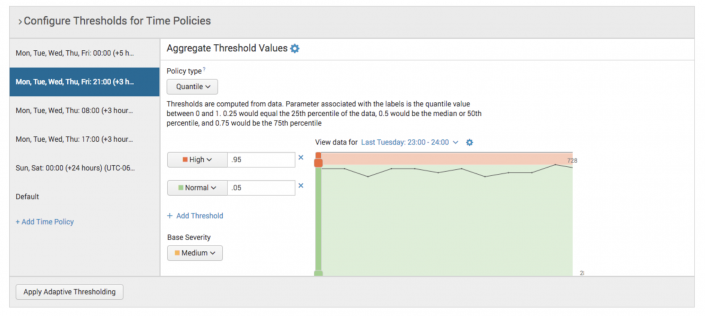
The following scenario walks through the process of configuring adaptive thresholding for a KPI. The sample KPI represents logins to a web server that exhibits different behaviors each day of the week and each hour of the day.
In this example, the training window is 7 days. However, as you identify smaller and smaller time policies, you might need to increase it to 14, 30, or 60 days to ensure that you have adequate data points in your short time windows to generate meaningful threshold values.
To begin your policy configuration, you must decide on the severity parameters for the chosen adaptive thresholding algorithm that align with your severity definitions. You've determined the following information about your data:
-
Quantileis the right algorithm for this KPI. - >95% is the high threshold.
- <5% is the medium threshold.
You click Apply Adaptive Thresholding.
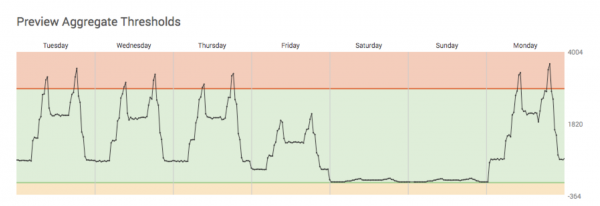
The first thing you're likely to notice when looking at the week-long KPI graph is that certain times of the day or days of the week are predictably different than other times. Perhaps AM differs from PM, or weekends differ from weekdays. These variations are almost always explainable and expected, but you should work with the service owners to confirm.
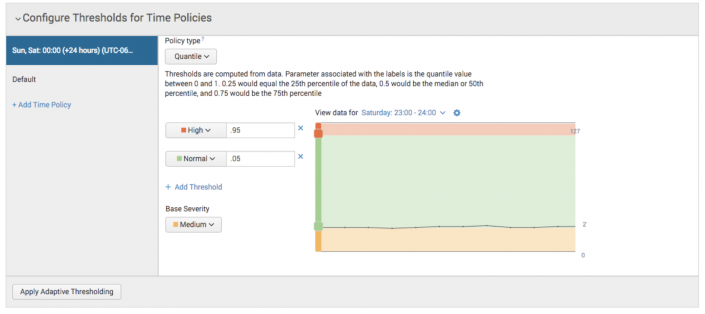
Presuming the variation is expected, the next step is to create a time policy to encapsulate that difference. In your case, you expect weekend traffic to your site to be very light. You start by separating weekend traffic from the work week with a new time policy. Apply the same adaptive threshold algorithm and severity values to your new time policy, and apply adaptive thresholds again.
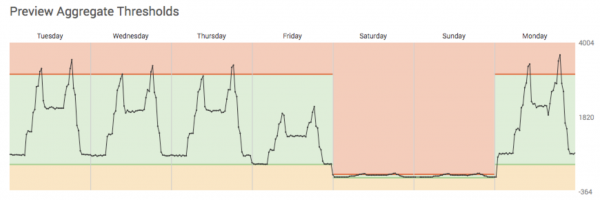
ITSI only uses the historical data points within that time policy to determine the threshold values. Thus the difference is now better accounted for.
It's clear that you've made improvements, but you still see problems. There are some spikes going into the red on Monday. After working with the service team, they tell you that logins predictably spike around 8am and 5pm most every day of the work week. You can create time policies to isolate those spikes. You can also create time policies to isolate the work week evenings where things are quieter.
The thresholds might not be perfect and you'll probably have to continue this process to create the right number of time policies. However, you've applied a methodical approach and can justify the purpose of each time policy.
Configure alerts for abnormal thresholds
After you threshold your KPIs with adaptive thresholds, you need to consider what type of alert configurations make sense to transform abnormal KPI results into actionable alerts.
The following are two common alert strategies:
- Alert when a KPI is exhibiting extremely abnormal behavior.
- Alert when multiple KPIs are simultaneously exhibiting abnormal behavior.
However, depending on the algorithm and threshold values you choose, you might not be able to determine that a KPI is extremely abnormal. This is particularly true if you select a quantile algorithm. If that's the case, consider alerting when a KPI spends an excessive amount of time in an abnormal state.
When creating alerts based on the normalcy of multiple KPIs, try to identify two or three KPIs that are highly indicative of service health and create an alert only when most or all of them start to exhibit abnormal behavior. For example, to identify looming service issues, you might alert based on abnormal results from KPIs for count of errors in a log file and the number of successful logins.
You might also want to consider looking at multiple KPIs across two or more critical tiers of your service. For instance, if you're seeing abnormal error counts in your web tier and your services tier, you might have an issue.
| Create time-based static KPI thresholds in ITSI | Overview of deep dives in ITSI |
This documentation applies to the following versions of Splunk® IT Service Intelligence: 4.12.0 Cloud only, 4.12.1 Cloud only, 4.12.2 Cloud only, 4.13.0, 4.13.1, 4.13.2, 4.13.3, 4.14.0 Cloud only, 4.14.1 Cloud only, 4.14.2 Cloud only, 4.15.0, 4.15.1, 4.15.2, 4.15.3, 4.16.0 Cloud only

 Download manual
Feedback submitted, thanks!