Monitor your services with the ITSI Service Analyzer
The Service Analyzer in IT Service Intelligence (ITSI) shows a unified view of all the services and KPIs in your IT environment. To access the Service Analyzer tile view, click the tile icon ![]() on the Service Analyzer. Whichever view you save last loads the next time you open the Service Analyzer.
on the Service Analyzer. Whichever view you save last loads the next time you open the Service Analyzer.
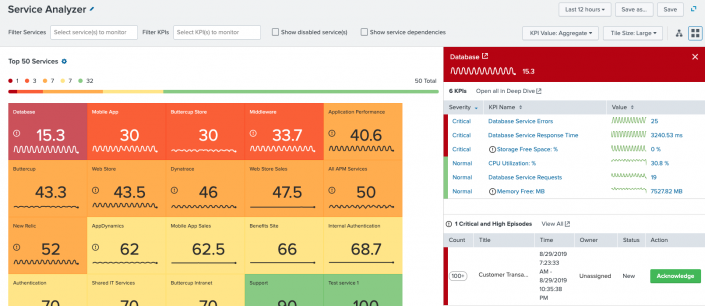
The Service Analyzer lists the top 50 most critical services and KPIs you're monitoring. Change the number of services or KPIs to display by clicking the gear icon ![]() . The number and color of each tile indicates the current severity level of the service or KPI, while the sparkline shows the trend of the value for the selected time range. The following image shows an example Service Analyzer:
. The number and color of each tile indicates the current severity level of the service or KPI, while the sparkline shows the trend of the value for the selected time range. The following image shows an example Service Analyzer:
A notification icon ( ![]() ) on a tile indicates one or both of the following conditions exists within the selected time range:
) on a tile indicates one or both of the following conditions exists within the selected time range:
- The service or KPI has one or more entities in a degraded state.
- The service has one or more critical or high episodes associated with it.
Hover over the icon to find out which conditions exist. Select the tile to open the side panel with more information.
You can only view services and KPIs that you have read access to. Read and write access to services and KPIs is controlled by teams. For information about teams, see Overview of teams in ITSI in the Administration Manual.
The minimum time range that can be selected in the time picker is 45 minutes. This is the minimum length of time needed to ensure all KPI data is available.
Filter services and KPIs
You can't filter services or KPIs unless you have read access to those services and KPIs.
Filter the services and KPIs in your environment using the Filter Services, Filter KPIs, and Filter by Tags boxes. When you filter by service, only the KPIs that belong to the filtered services are displayed. When you filter by KPI, only the services associated with the KPI are displayed. When you filter by tags, only services containing those tags are shown, as well as their KPIs.
All filters added within a single filter box have an implied OR clause. For example, service_A OR service_B. However, across the filter boxes there's an implied AND clause. For example, service_A AND kpi_B AND tag_C.
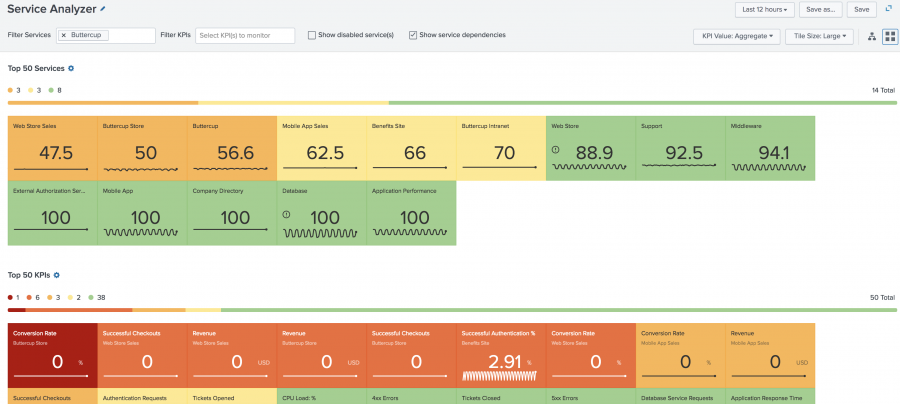
The checkboxes for showing disabled and dependent services are applied after the filters in the boxes. For example, if you filter to the Buttercup Store service and enable Show service dependencies, additional KPIs appear that are part of the dependent services. However, if you then add a KPI filter for one of those additional KPIs, nothing is returned because now nothing fits the combination of filters in the filter boxes.
The filters support wildcards. For example, if you want to display only your three database services called DB1, DB2, and DB3, you could simply filter by DB*.
You can also filter the KPIs for already filtered services. For example, to see only the Database Service Response Time KPI for the three database services, filter your KPIs by *response*.
Show disabled services
By default, disabled services and KPIs associated with disabled services are not shown on the Service Analyzer. Select Show disabled service(s) to display disabled services and their corresponding KPIs. The tiles for disabled services and KPIs are grey and display N/A instead of a number.
Show service dependencies
By default, when you filter by a service, the Service Analyzer only displays that service and its individual KPIs. Select Show service dependencies to also display the services that impact the filtered service and all KPIs within those services.
Filter KPI values
Click the KPI Value: Aggregate dropdown and select Max Severity if you want to see Max Severity in this view. See Aggregate versus maximum severity KPI values in ITSI for information.
For the Tile view, in the Top 50 Services and Top 50 KPIs sections, click the gear icon and select the number of services and KPIs to monitor.
Automatically refresh the Service Analyzer
You can configure the Service Analyzer to automatically refresh. By default, auto-refresh is disabled. Enable it in itsi_service_analyzer.conf.
Auto-refresh automatically refreshes all of the searches displayed on the Service Analyzer. So if you have the KPI side panel open, those searches are also executed. Auto-refresh doesn't execute service health score or KPI calculations. It only refreshes the searches on the Service Analyzer by fetching the latest calculated health score from the itsi_summary index.
Real-time searches such as Real-time and All time are not available in the time range picker.
Prerequisites
- Only users with file system access, such as system administrators, can enable automatic refresh using a configuration file.
- Review the steps in How to edit a configuration file in the Admin Manual.
Never change or copy the configuration files in the default directory. The files in the default directory must remain intact and in their original location.
Steps
- Open or create a local itsi_service_analyzer.conf file at $SPLUNK_HOME/etc/apps/SA-ITOA/local.
- Add the following stanza:
[auto_refresh]
disabled = 0
interval = 180
- Restart your Splunk software.
The interval setting is in seconds and defines the time interval to automatically refresh the Service Analyzer. This configuration file setting applies to the default Service Analyzer and all saved service analyzer views.
Create a custom service analyzer view
Create and save any number of custom service analyzer views to meet your particular monitoring needs. You can create tile or tree views. Use the filters to create custom views of service health and save each view as a new service analyzer.
Steps
- In the main ITSI menu, click Service Analyzer > Analyzers.
- Click Create Service Analyzer.
- Enter a Title and optional Description, an set the privacy for the Service Analyzer.
- Click Create.
- Click the name of the service analyzer from the Saved Service Analyzers lister page.
- Open the time range picker and set a time range for the new view. The Service Analyzer only supports relative time ranges, not real-time searches. The time range must be at least 45 minutes.
- In the
Filter ServicesandFilter KPIsfields, select the services and/or KPIs that you want to display.
All other services and KPIs are hidden. - (Optional) Click the KPI Value: Aggregate dropdown and select Max Severity if you want to see Max Severity in this view.
- For the Tile view, in the Top 50 Services and Top 50 KPIs sections, click the gear icon and select the number of services and KPIs to monitor.
- Click Save to save the customizations to the Service Analyzer view.
Monitor services
The number displayed in a service tile indicates the service health score. Service health scores range from 0 to 100, with 0 being most critical and 100 being most healthy.
| Service Health Score | Severity level | Color |
|---|---|---|
| 0-20 | Critical | |
| 20-40 | High | |
| 40-60 | Medium | |
| 60-80 | Low | |
| 80-100 | Normal |
The service health score calculation is based on the current severity level of service KPIs (critical, high, medium, low, and normal) and the user-defined KPI importance value. For information about how the service health score is calculated, see How service health scores work in ITSI in this manual.
If a service is in maintenance mode, the tile is dark grey and contains a maintenance icon ![]() .
.
Monitor KPIs
The number displayed in a KPI tile is the number returned from the KPI search of the data. For example, you could have a KPI called Successful Logins that is a count of logins to your website. When a KPI is created in ITSI, aggregate severity-level thresholds of Normal, Low, Medium, High, and Critical are defined. If a KPI is split by entity, entity severity-level thresholds are also defined. The color corresponding to the aggregate severity-level is displayed in the KPI tile in the Service Analyzer by default. For more information about configuring KPI severity levels, see Configure KPI thresholds in ITSI in the Service Insights manual.
The name of the service that the KPI is associated with is displayed on the line beneath the name of the KPI for reference.
Grey KPI tiles indicate one of the following conditions:
- The KPI search has returned no data matching the search criteria. The sparkline is flat in this case.
- The KPI is associated with a disabled service (when the Show disabled service(s) check box is checked).
- The KPI is associated with a service in maintenance mode (displayed in dark grey with a maintenance icon
 )
)
Drill down to a deep dive
You can drill down from the Service Analyzer tile view to a deep dive where you can view and compare service health scores or KPI search results over time.
- Select the check box on one or more service or KPI tiles.
- Click Drilldown to Deep Dive.
If you select a single service or a single KPI, all KPIs associated with that service appear in the deep dive. If you select multiple services or KPIs, only the associated service health scores appear.
For more information about deep dives, see Overview of deep dives in ITSI in this manual.
Investigate a service with poor health
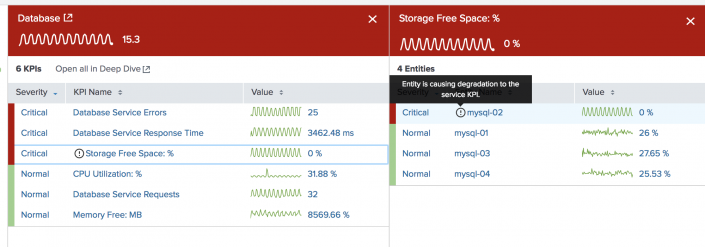
To investigate a service with poor health or a service that displays a notification icon, click the service tile. A panel opens displaying the severity and values of the KPIs associated with the service and up to 20 episodes associated with the service that have a severity of critical or high. Furthermore, you can click on a KPI in the side panel (or on a KPI tile) to see a secondary panel that shows the severity and value of any entities that contribute to the KPI.
If you bookmark or copy the URL for a service analyzer page, the service or KPI that is selected and any side panels that are open are saved as part of the page.
Scenario
You are an IT Operations analyst monitoring service health on the ITSI Service Analyzer.
- You notice a notification icon on the Database Service tile. You hover over the icon and see a message that the service has entities in a degraded state and also has critical or high episodes associated with it.
- You click the Database tile and a side panel opens showing the service KPIs and the critical or high episodes.

You see that one KPI has a notification icon indicating that it has entities in a degraded state. You also see there is one episode in a critical state containing over a hundred events. You click Acknowledge to indicate that you're actively working on the episode.
Tip: Click View All to view the episodes in Episode Review. Episode Review opens in a new tab and is filtered for the service you're viewing and the time range you're using on the Service Analyzer page. For information about Episode Review, see Overview of Episode Review in ITSI.
- You click the Storage Free Space KPI with the notification icon. A secondary panel opens showing the contributing entities for this KPI.

You can now observe that themysql-02entity is in a critical state and has no free space. You have discovered the root cause of the service degradation. - You click the name of the entity to see more information about the host on the Entity Details page. From here, you can see entity details such as title, host, application, itsi_role, version, and family.
You can only edit an entity on the Entity Details page if you have write permissions to the Global team. By default only the
itoa_adminrole has write permissions to the Global team.
Why does a tile say "Waiting for data"?
You can change the number of tiles shown in the Service Analyzer. If you set the number of tiles too high (50 or greater), the two indexed real-time searches that generate the tiles might hang and show a "Waiting for data" message. This occurs only on the specific search head. This issue mostly occurs as a result of KV store performance issues in a search head cluster environment.
Workarounds:
- Avoid increasing the number of tiles in a search head cluster environment.
- Use filters to display only the specific services and KPIs that require monitoring.
- Set the number of visible tiles to the lowest number possible.
| Overview of the Service Analyzer in ITSI | Use the Service Analyzer tree view in ITSI |
This documentation applies to the following versions of Splunk® IT Service Intelligence: 4.11.0, 4.11.1, 4.11.2, 4.11.3, 4.11.4, 4.11.5, 4.11.6, 4.12.0 Cloud only, 4.12.1 Cloud only, 4.12.2 Cloud only, 4.13.0, 4.13.1, 4.13.2, 4.13.3, 4.14.0 Cloud only, 4.14.1 Cloud only, 4.14.2 Cloud only, 4.15.0, 4.15.1, 4.15.2, 4.15.3, 4.16.0 Cloud only, 4.17.0, 4.17.1

 Download manual
Feedback submitted, thanks!