Scenario: Use ITSI Predictive Analytics
With ITSI Predictive Analytics, you can build and train predictive models and use them to create alerts. This example demonstrates how to use ITSI Predictive Analytics to build a machine learning model, and use the model to generate predictions that you can use to make business decisions.
Scenario
You are an IT operations admin for the Middleware team. The Middleware service has experienced several costly outages in the past. To predict and avoid future outages, you want to create a machine learning model of the Middleware service using ITSI's Predictive Analytics capability.
Use case overview
This use case includes the following high-level tasks:
- Determine if the service is a good fit for modeling
- Train a model
- Test the model
- Create an alert from the model
- Perform root cause analysis using the Predictive Analytics dashboard
- Retrain the model on new data
Step 1: Determine if the service is a good fit for modeling
Before you create a predictive model for the Middleware service, you want to make sure that the service is suitable for predictive modeling. You set the time period on the Predictive Analytics tab to Last 14 days so you can get an idea of how the Middleware service's health scores have varied over the last two weeks.
You look at the graph of service health scores and KPIs over time and see that the data is relatively cyclical with no obvious outliers.
You consult the histogram of service health scores and see that the distribution is fairly uniform (the data is spread evenly across the range of health scores). With this even distribution, ITSI's machine learning models are less likely to produce biased results.
Because the Middleware service data contains no outliers and is evenly distributed, you determine that the Middleware service is a good fit for predictive modeling.
Step 2: Train a model
Now that you've decided to model the Middleware service, it's time to train a predictive model. You go to the Middleware service's Predictive Analytics tab to configure the training inputs.
Time period
You need to provide the model with enough data to capture the relationships that exist among the Middleware service's past KPI values and service health scores. Your last outage occurred two months ago, and you want to provide that data to the model so it can be trained on the difference between normal and abnormal data. You decide to use the Last 90 days of data.
For help choosing an appropriate time period, see Specify a time period.
Algorithm type
There are two types of algorithms you can use to train predictive models in ITSI: regression and classification. Regression algorithms predict a numerical service health score, and classification predicts a service health state.
Regression is best when there's a pattern for health scores in the past, and classification is best when there's no pattern but rather random drops. Because there's a cyclical pattern to the Middleware service's historical health scores, you decide to use Regression. When monitoring the Middleware service, you prefer that the health score doesn't drop below 75.
For help choosing an algorithm type, see Choose an algorithm type.
Algorithm
Because you chose regression, you have three algorithms to choose from: linear regression, random forest regressor, and gradient boosting regressor. You already determined that the Middleware service data is fairly cyclical, with regular rises and falls in service health score values. Because the relationships to be modeled are relatively simple, you decide to go with Linear Regression.
For help choosing an algorithm, see Choose a machine learning algorithm.
Split for training/test
A common machine learning strategy is to take all available data and split it into training and testing subsets. The train partition provides the raw data from which the predictive model is generated. The test set is used to evaluate the performance of the trained model.
You know that a larger split works well for large datasets, and a more normal split (like 70/30) works best for small datasets. Your dataset of 90 days is fairly large, especially since the Middleware service contains 8 KPIs and 22 entities. You decide to increase the train/test split to 80/20. This split trains the model on 80% of the data, and uses the remaining 20% to test and evaluate it.
For help choosing an appropriate split ratio, see Split your data into training and test sets.
After everything's configured, your training inputs look like this:
Step 3: Review the model's predictive performance
It's always a good idea to evaluate a model to determine if it will do a good job predicting future health scores. You want to make sure that the predictions the model generates will be close to the eventual outcomes.
After you click Train, the model is created in the Test a Model section.
You select the LinearRegression model, the recommended model, to generate the results. The recommended model is the one that had the best performance on the test set. If you don't have a data science or machine learning background and are confused about which model to choose, consider choosing the recommended model.
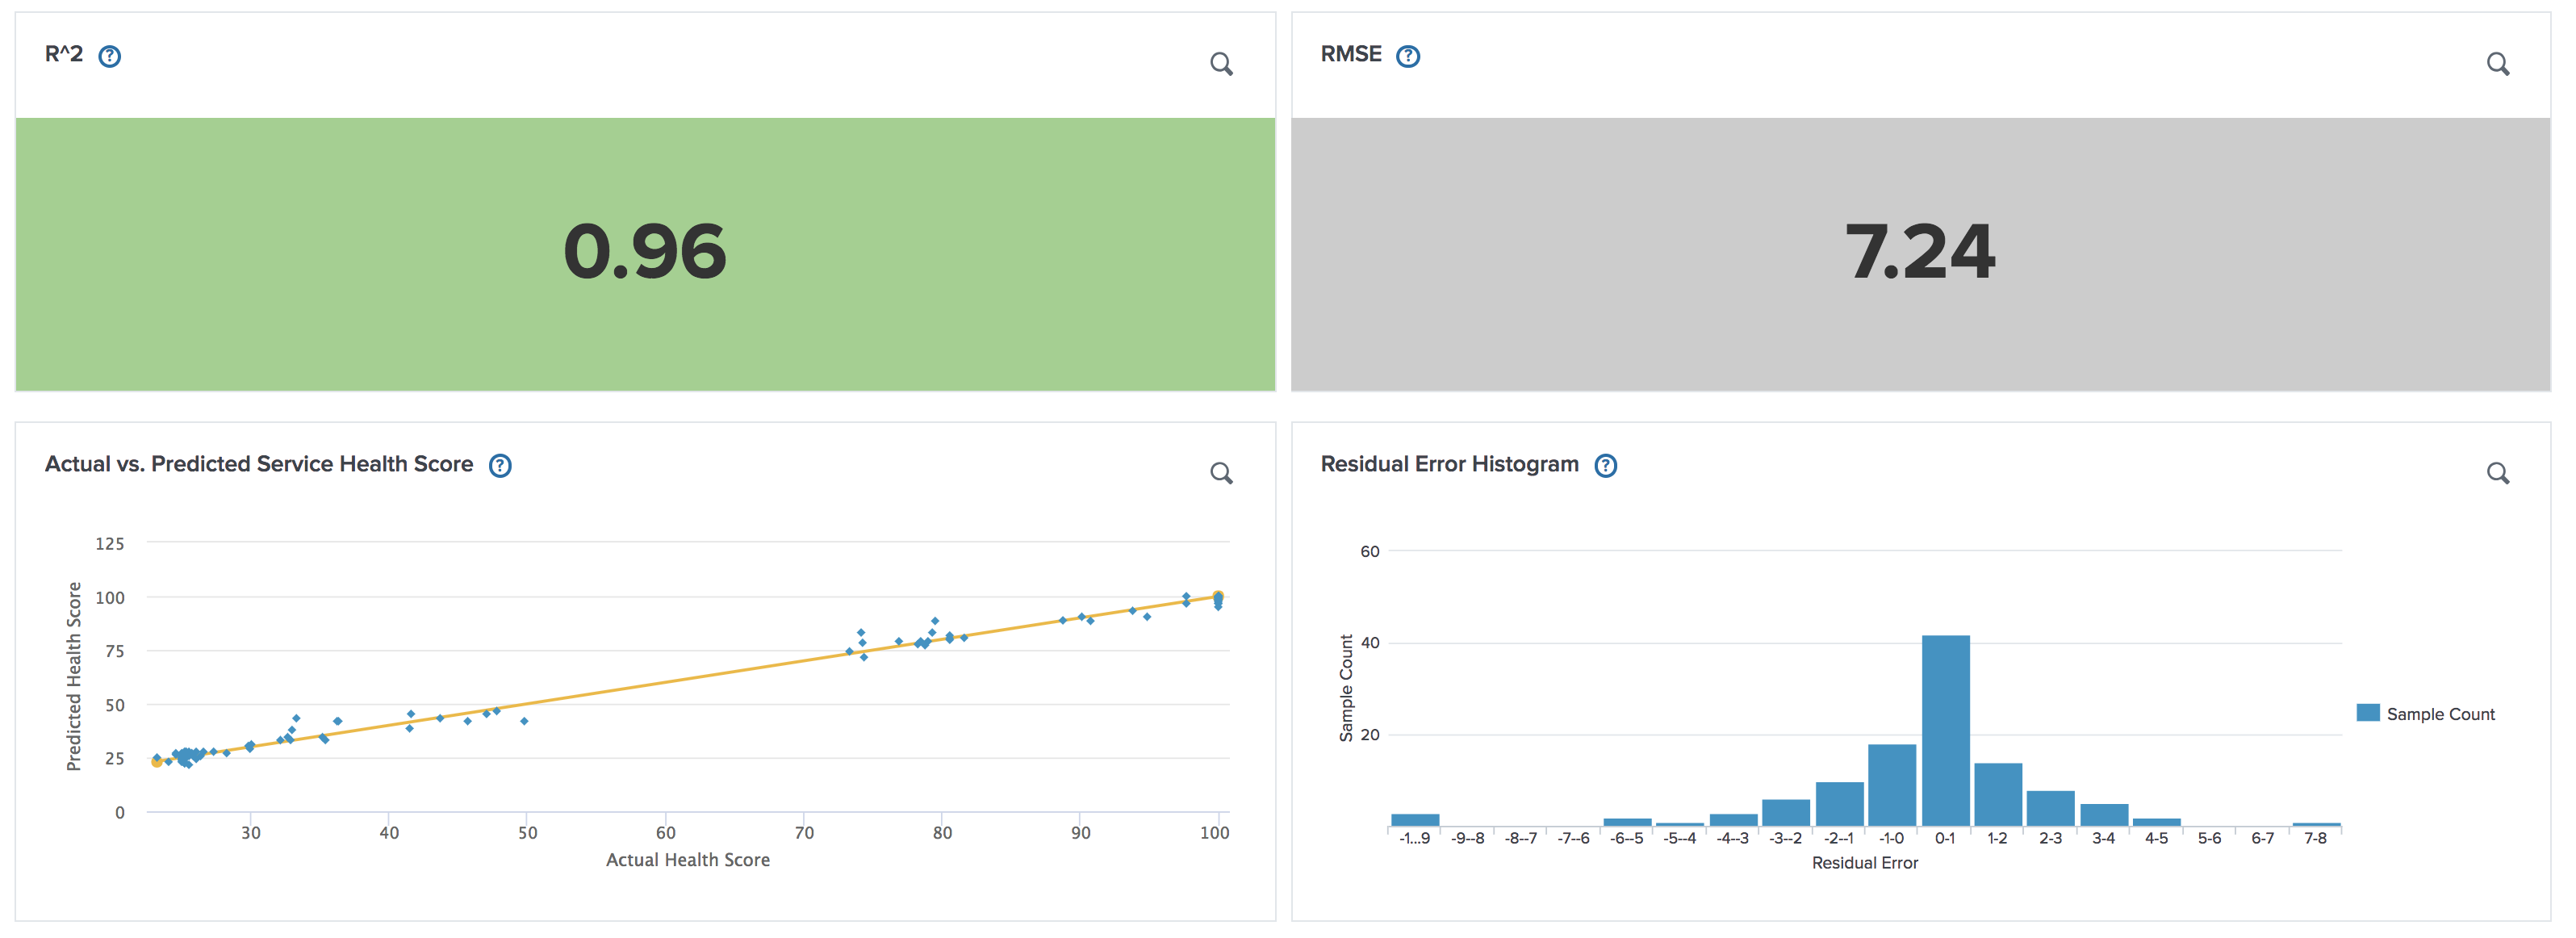
ITSI provides the following industry-standard metrics and insights to summarize the predictive accuracy of your model:
You make the following observations about the test results:
- The R2 of
0.96is very high on a scale of 0 to 1. - The RMSE of
7.24is relatively small. - On the graph of actual versus predicted health scores, most of the points fall close to or exactly on the line. This suggests a large number of correct predictions, which means the model has high performance.
- The residual error histogram has a normal (bell-shaped) distribution with most values close to 0.
Your observations indicate that the linear regression model performs well across various performance metrics. You decide to go with this model, and you click Save to save it into the service definition.
For more information about testing predictive models, see Test a predictive model in ITSI.
Step 4: Set a score threshold and create an alert
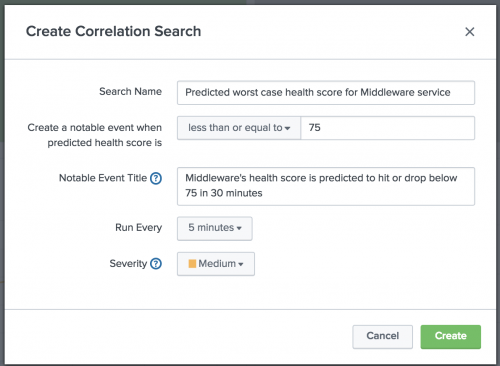
Now that you've saved the model into the service, you want to create an alert so you can be notified if the health score of the Middleware service is predicted to reach a certain worst-case level in the future. You click the bell icon (![]() ) in the Worst Case Service Health Score panel to open the correlation search modal. You want ITSI to generate a notable event in Episode Review the next time the Middleware service's health is expected to degrade.
) in the Worst Case Service Health Score panel to open the correlation search modal. You want ITSI to generate a notable event in Episode Review the next time the Middleware service's health is expected to degrade.
Configure the following inputs:
Because you want the Middleware service's health score to stay between 75 and 100, you decide to generate an alert when the predicted health score is predicted to be 75 or less.
You configure the initial severity of the notable event to be Medium because a health score of 75 doesn't necessarily indicate a severe outage. You might create another correlation search that generates a Critical event if the health score drops below 30, as this is a more critical situation.
For instructions to create alerts for predictive models, see Create an alert for potential service degradation in ITSI.
Step 5: Use the model to generate predictions and find root cause
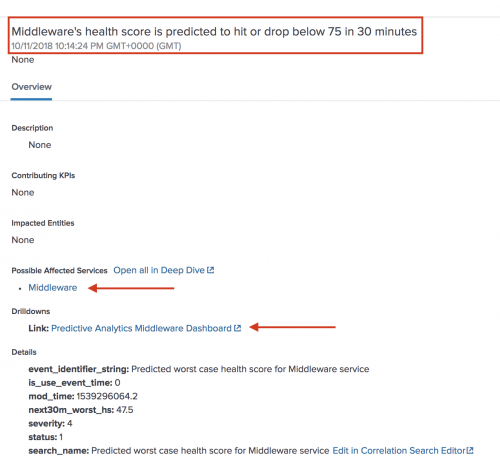
Two days later, one of your IT operations analysts is monitoring Episode Review and sees the following notable event:
The event details indicate that the Middleware service is predicted to degrade to an unacceptable level within the next 30 minutes.
The analyst clicks the Predictive Analytics Middleware Dashboard drilldown link. This high-level dashboard lets analysts perform root cause analysis by viewing the top five KPIs contributing to a potential outage and how those KPIs are likely to change in the next 30 minutes.
The analyst sees the following information in the dashboard:
Along with the predicted health score in 30 minutes, ITSI calculates the top 5 KPIs that are likely contributing to the degraded health score. The analyst determines that the Middleware service is likely to degrade because of an increased amount of 5xx errors, which is the top offending KPI. The analyst opens a ticket with the Middleware team to address the 5xx error count before it becomes a problem.
For more information about using the dashboard, see Predictive Analytics dashboard.
Step 6: Retrain the model on new data
A month after creating the initial model for the Middleware service, you make a change to one of the KPIs in the service. It is good practice to continuously monitor your incoming data (historical KPI and service health score values) and retrain a model on newer data if KPIs or entities are added, removed, or changed.
You decide to test the existing model on recent data to evaluate whether it needs to be retrained.
On the Middleware service's Predictive Analytics tab, you navigate to the Test a Model section where the current model is saved. You change the Test Period to Last 90 days and select the LinearRegression model. This tests the existing model on the last 90 days of data.
The best metrics to review when retesting a model are R2 and RMSE because they allow you to make a direct numerical comparison to the original values.
You see the following results:
The test results indicate that R2, a measure of how well the model fits, has decreased from 0.96 to 0.41. RMSE, which should be relatively small, has increased from 7.24 to 28.70. These metrics are unacceptably low, so you decide to retrain the model.
You select the same training inputs as before and click Train. Training with the same algorithm replaces the existing model with the retrained model.
After the model is trained, you consult the Test a Model section to review the new model's predictive performance. The test results display the following metrics:
The R2 value has increased significantly and RMSE has dropped significantly. The values are close to what they were when you originally trained the model. The model's performance has increased after you retrained it on recent data, accounting for the recent change to the Middleware service's KPI. You are satisfied with the new model's performance and click Save to save it into the service definition.
For instructions to retrain a model, see Retrain a predictive model in ITSI.
| Predictive Analytics performance considerations in ITSI | Overview of the glass table editor in ITSI |
This documentation applies to the following versions of Splunk® IT Service Intelligence: 4.11.0, 4.11.1, 4.11.2, 4.11.3, 4.11.4, 4.11.5, 4.11.6, 4.12.0 Cloud only, 4.12.1 Cloud only, 4.12.2 Cloud only, 4.13.0, 4.13.1, 4.13.2, 4.13.3, 4.14.0 Cloud only, 4.14.1 Cloud only, 4.14.2 Cloud only, 4.15.0, 4.15.1, 4.15.2, 4.15.3, 4.16.0 Cloud only, 4.17.0, 4.17.1, 4.18.0, 4.18.1, 4.19.0, 4.19.1, 4.19.2, 4.19.3, 4.19.4, 4.20.0, 4.20.1


 Download manual
Feedback submitted, thanks!