Analyze entity performance metrics in ITSI
Analyze performance metrics for a single entity on the entity's Analytics dashboard within (ITSI). Determine poor performing entities for a set of metrics, or determine a point in time when multiple entities began performing in a similar way. Use the visualizations to perform root cause analysis and understand why your infrastructure is performing the way it is. The insights can help you quickly identify and respond to issues or anomalies in your data.
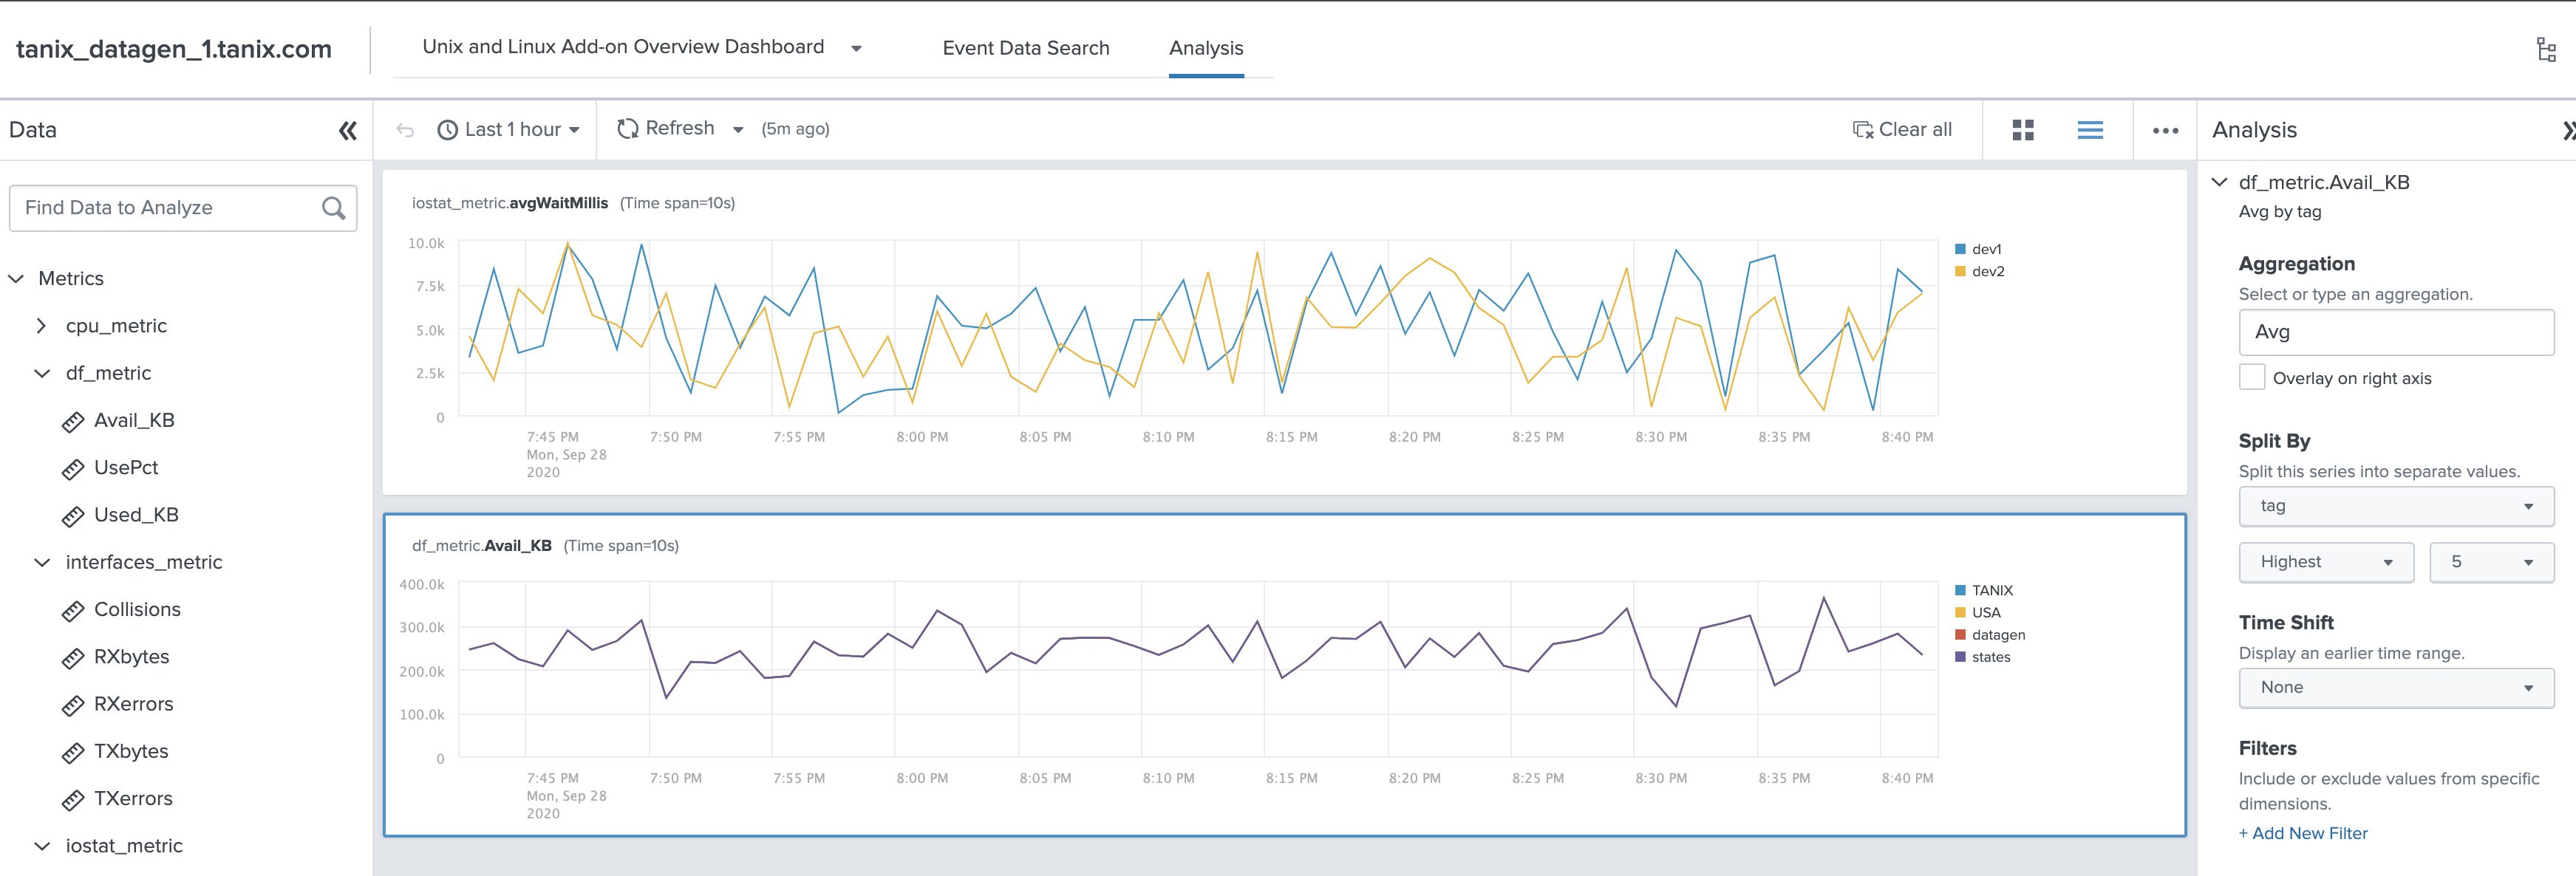
You can select different data sources to create interactive charts. Then apply filters and aggregations to gain insight into your system's metrics and performance. The following image shows an entity's Analytics view:
Access the Analytics dashboard
Follow these steps to access the Analytics dashboard for an entity:
- From the ITSI main menu, click Entity Overview.
- Find and open the entity you want to analyze, filtering by dimensions if needed.
- Select the Analytics tab for the entity.
Analytics Workspace
The entity Analytics view leverages the Splunk Analytics Workspace, which provides a user interface to monitor and analyze metrics and other time series without using SPL. The workspace comes with a set of analytic functions and operations to help you make sense of your data. For more information about the Analytics Workspace, see About the Analytics Workspace in the Splunk Enterprise Analytics Workspace manual.
See the following resources to perform different tasks within the Analytics Workspace:
| Topic | Description |
|---|---|
| Charts in the Analytics Workspace | Create charts to see your data represented as a time series. |
| Analytics in the Analytics Workspace | Configure analytic functions and operations to gain insight from your charts. |
| Dashboards in the Analytics Workspace | Use dashboards to monitor real-time trends in your data or to share visualizations with your colleagues. |
Entity Analytics and alerting in ITSI
While the Analytics dashboard doesn't contain the entity alerting functionality that the Splunk Analytics Workspace provides, in ITSI only you can still set up alerts for KPIs so you receive a notification when a KPI reaches a certain threshold. For more information, see Receive alerts when KPI severity changes in ITSI in the ITSI Service Insights manual.
| Event Data Search dashboard in ITSI | Understand entity status and search data in ITSI |
This documentation applies to the following versions of Splunk® IT Service Intelligence: 4.18.0, 4.18.1, 4.19.0, 4.19.1, 4.19.2, 4.19.3, 4.19.4, 4.20.0

 Download manual
Feedback submitted, thanks!