Use the Service Analyzer tree view in ITSI
Use the Service Analyzer tree view to see a visual representation of your services and the dependencies between them. Using this view you can also see the KPIs, entities, and most critical notable events associated with a service.
To use the Service Analyzer tree view, click the tree icon ![]() in the Service Analyzer.
in the Service Analyzer.
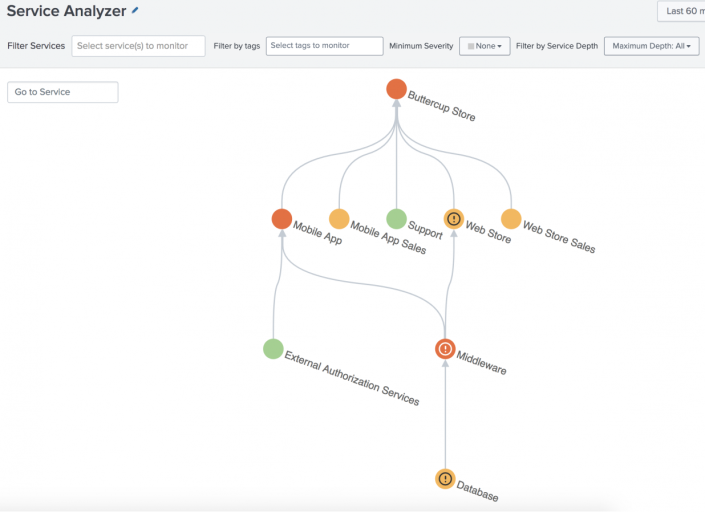
The tree visualization shows dependent services. The following dependencies exist in the above example:
- The Buttercup Store service is dependent on the Mobile App Sales, Mobile App Service, Support, Web Store Sales, and Web Store Service services.
- The Mobile App Service is dependent on External Authorization Services and Middleware Service.
- The Web Store Service is also dependent on the Middleware Service.
- The Middleware Service, in turn, is dependent on the Database Service.
If any circular dependencies exist, the dependency in one direction is represented by a solid line and the dependency in the other direction is represented with a dotted line. It is not recommended to create circular dependencies.
The nodes are color coded to indicate the health of the service. Nodes for services that are disabled or in maintenance mode are gray. For an explanation of the colors, see Monitor services in this manual.
Hover over a node to see only the service and its dependent services. Show or hide a service's dependencies by toggling the caret symbol next to the node of any service with dependencies. This "collapses" the service tree to limit your view to only the services that you want to analyze.
A notification icon ![]() displays on nodes that have degraded entities, one or more critical or high episodes, or both conditions within the selected time range. Hover over the icon to find out which condition exists. Click on the node to open the side panel to get more information. The notification icon is not displayed for services that are disabled or in maintenance mode. The icon is not displayed for critical or high episodes if the episodes are in a resolved or closed state.
displays on nodes that have degraded entities, one or more critical or high episodes, or both conditions within the selected time range. Hover over the icon to find out which condition exists. Click on the node to open the side panel to get more information. The notification icon is not displayed for services that are disabled or in maintenance mode. The icon is not displayed for critical or high episodes if the episodes are in a resolved or closed state.
You can save a customized service analyzer tree view and your filter settings. For more information, see Create a custom service analyzer view.
The minimum time range that can be selected in the time picker is 45 minutes. This is the minimum length of time needed to ensure all KPI data is available. If you select Last 15 minutes, or any time range that is less than 45 minutes, the time picker is automatically set to 45 minutes.
Use the Filter Services box to see only a particular service or services and their dependencies. Select one or more services from the dropdown list or type text in the box and use * as a wildcard. For services that match the filtering criteria, the entire tree for which the service is a member is displayed.
Use the Minimum Severity filter to see all services that match or have a lower severity than a specific severity criteria. Changes to this filter are saved when you save a service analyzer view.
Use the Filter by Service Depth filter to view services based on the number of dependent services related to the primary service. For example, when you filter by a service depth of 2, all services that have up to two service dependencies are displayed. Changes to this filter are saved when you save a service analyzer view.
Use the Go to Service box to quickly navigate to a service. Note that if filtering has been applied, only the services that meet the filtering criteria will be available.
Note: Nodes are not displayed for services for which you do not have read access. You also cannot filter services unless you have read access to those services. Read and write access to services is controlled by service-level permissions. For information about service-level permissions, see Implement teams in ITSI.
View KPIs and episodes
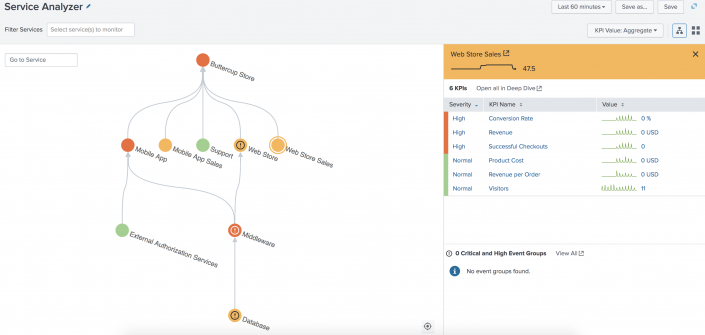
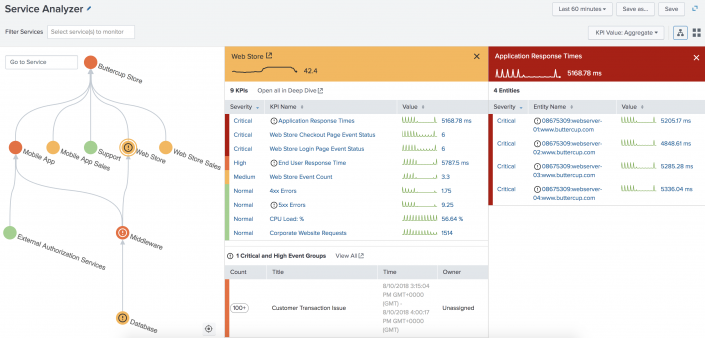
Select a node to investigate a service with poor health. The side panel displays the service health score, the severity and values of the KPIs associated with the service, and up to 20 episodes associated with the service that have a severity of critical or high. This information enables you to immediately start investigating.
KPIs
Any KPIs that have entities in a degraded state display a warning icon. Click the KPI to see its contributing entities.
Click the Open all in Deep Dive link to open the KPIs in a deep dive to perform further investigation. See Overview of deep dives in ITSI for information on deep dives.
Episodes
Click the View All link to view the episodes in Episode Review. Episode Review opens in a new tab and is filtered for the service you are viewing and the time range you are using on the Service Analyzer page.
For information about Episode Review, see Overview of Episode Review in ITSI.
View contributing entities for a KPI
To see the severity and value of any entities that contribute to a KPI, select the KPI in the side panel. A secondary panel opens with the KPI and its entities. If any entities are causing degradation to the service KPI, they display a warning icon.
Select the name of the entity to open the Entity Detail page which lists the title, host, application, itsi_role, version, and family.
View large number of services
When you have more than 2,000 services in your system, the tree view only displays a subset of your total services. ITSI automatically applies the minimum required service depth filter in order to show less than 2,000 services, otherwise you'll see an error. When viewing a service tree with a large number of services, filter to a specific service, or adjust the service depth and set the minimum severity to avoid performance issues.
| Monitor your services with the ITSI Service Analyzer | Overview of creating KPIs in ITSI |
This documentation applies to the following versions of Splunk® IT Service Intelligence: 4.18.0, 4.18.1, 4.19.0, 4.19.1, 4.19.2, 4.19.3, 4.19.4, 4.20.0


 Download manual
Feedback submitted, thanks!