Detect Numeric Outliers
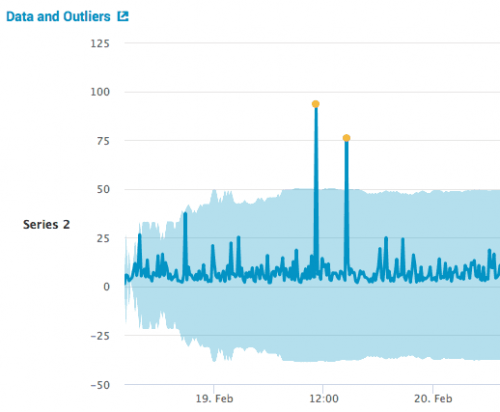
The Detect Numeric Outliers assistant determines values that appear to be extraordinarily higher or lower than the rest of the data. Identified outliers are indicative of interesting, unusual, and possibly dangerous events. This assistant is restricted to one numeric data field. In the visualization below, the yellow dots indicate outliers.
Algorithm
The Detect Numeric Outliers assistant is compatible with the following distribution statistics:
- Standard deviation
- median absolute deviation
- interquartile range
Workflow
Input the data and select the parameters you want to investigate. When a situation violates the expectations for a parameter, it results in an outlier.
- Run a search.
- In Field to analyze, select a numeric field.
The list populates every time you run a search. - In Threshold method, select a method.
When you pick a method, consider both the distribution of the data, and how the method impacts outlier detection.Method Application Standard Deviation This method is appropriate If your data exhibits a normal distribution. Since the standard deviation method centers on the mean, it is more impacted by outliers. Median Absolute Deviation This method applies a stricter interpretation of outliers than standard deviation because the measurement centers on the median and uses Median Absolute Deviation (MAD) instead of standard deviation. Interquartile Range This method is appropriate when your data exhibits an asymmetric distribution. Instead of centering the measurement on a mean or median, it uses quartiles to determine whether a value is an outlier. - Specify a value for the Threshold multiplier.
The larger the number, the larger the outlier envelope, and therefore, the fewer the outliers. - (Optional) In the Sliding window field, specify the number of values to use to compute each slice of the outlier envelope.
A sliding window is useful if the distribution of your data changes frequently. If you do not specify a sliding window, the assistant uses the whole dataset which results in an outlier envelope of uniform size. - Select Include current point to include the current point in the calculations before assessing whether it is an outlier.
- (Optional) In Fields to split by, select up to 5 fields.
In the visualizations the data points are grouped by field, or if more than one split by field is specified, by the combination of the values of the fields. It is better to split by a categorical field than a numeric field. For example, if you detect outliers in grocery store purchases and analyze thequantityfield, you could split bystore_IDto group thequantitydata points by store. - Click Detect Outliers.
Interpret and validate
After you detect outliers, review your results in the tables and visualizations. Results commonly have a few outliers.
| Result | Application |
|---|---|
| Data and Outliers | Outliers, represented by yellow dots, are datapoint that fall outside of the light blue envelope. A chart to the right of the graph reports the total number of outliers. Hover over a yellow dot to see the value and quantity of an outlier. To learn more about the nature of the outlier, click it to drill down to the search query to see the base of the data point. |
| Split by fields | If you selected a field to split by, then the Data and Outliers chart displays up to 10 values that you can add or remove from the chart. The chart groups the data points based on split by field values. For example, if there are 3 split by field values, the chart will be broken out into 3 separate charts for each split value. The number of outliers for each split by field value is displayed to the right of the chart. |
| Outlier Count Over Time chart | This chart plots the outliers over time, and only appears if you use time series data. If you specify more than one split, the chart shows the outlier count for each field value. To see which values are too high or too low, check the box for Split outliers above and below threshold. If you split by field, each field contains a value for outliers above and below the threshold. |
| Data Distribution histogram | This histogram shows the distribution, and displays the number of data points within the threshold (the light blue area) and the number of data points outside the threshold. |
| Data and Outliers table | This table shows each outlier the corresponding value, as well as the the lists of values for any split by field. |
| Outlier Split Value Distribution | If you specified one or more split by fields, this table displays the number of outliers for each split value or combination of split values. |
Deploy numeric outlier detection
- Next to Detect Outliers, click Open in Search.
This opens a search query that uses all the data not just the training set. - Next to Open in Search, click Show SPL to see the search query that used to detect outliers.
You can use this same query on a different data set. - Click Schedule Alert button in a panel to set up an alert when the number of outliers outside both thresholds, above the upper threshold, or below the lower threshold exceeds a specified value.
- After you save the alert, you can access it from the Scheduled Jobs > Alerts menu.
- Click any title to go to a new Search tab.
The search bar contains a search query to replicate the outlier detection calculations.
| Predict Categorical Fields | Detect Categorical Outliers |
This documentation applies to the following versions of Splunk® Machine Learning Toolkit: 2.4.0, 3.0.0, 3.1.0

 Download manual
Feedback submitted, thanks!