Detect Categorical Outliers Classic Assistant
Classic assistants enable machine learning through a guided user interface. The Detect Categorical Outliers Classic Assistant identifies data that indicate interesting or unusual events. This assistant works with non-numeric and multi-dimensional data, such as string identifiers and IP addresses. To detect categorical outliers, input data and select the fields for which to look for unusual combinations or a coincidence of rare values. When multiple fields have rare values, the result is an outlier.
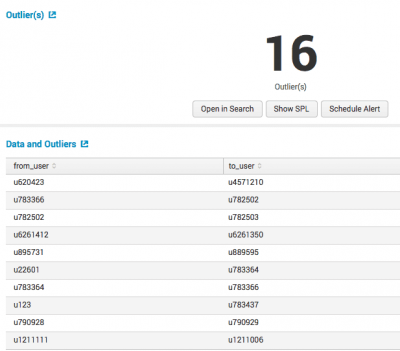
The following image illustrates results from the showcase example in the Splunk Machine Learning Toolkit with Bitcoin data.
Algorithm
The Detect Categorical Outliers assistant uses the probabilistic measures algorithm.
Detect Categorical Outliers
To detect categorical outliers, input data and select the fields to analyze.
Workflow
Follow these steps for the Detect Categorical Outliers Classic Assistant.
- From the MLTK navigation bar select Classic > Assistants > Detect Categorical Outliers.
- Run a search, and be sure to select a date range.
- Select the fields you want to analyze. The list populates every time you run a search.
- Click Detect Outliers.
Interpret and validate
After you detect outliers, review your results and the corresponding tables. Results often have a few outliers.
| Result | Definition |
|---|---|
| Outliers | This result shows the number of events flagged as outliers. |
| Total Events | This result shows the total number of events that were evaluated. |
| Data and Outliers | This table lists the events that marked as outliers, and the corresponding reason that the event is marked as an outlier. |
Deploy categorical outlier detection
- Click Open in Search to to generate a New Search tab for this same dataset. This new search will open in a new browser tab, away from the Classic Assistant.
This search query uses all data, not just the training set. You can adjust the SPL directly and see results immediately. You can also save the query as a Report, Dashboard Panel or Alert. - Click Show SPL to generate a new window showing the search query that was used to calculate the outliers. Copy the SPL here for use in other aspects of your Splunk instance.
Once you navigate away from the Classic Assistant page, you cannot return to it through the Classic or Models tabs. Classic Assistants are great for generating SPL, but may not be ideal for longer-term projects.
For more information about alerts, see Getting started with alerts in the Splunk Enterprise Alerting Manual.
| Detect Numeric Outliers Classic Assistant | Forecast Time Series Classic Assistant |
This documentation applies to the following versions of Splunk® Machine Learning Toolkit: 3.4.0, 4.0.0, 4.1.0, 4.2.0, 4.3.0

 Download manual
Feedback submitted, thanks!