Welcome to the Machine Learning Toolkit
The Machine Learning Toolkit (MLTK) is an app available for both Splunk Enterprise and Splunk Cloud users through Splunkbase. The Machine Learning Toolkit acts like an extension to the Splunk platform and includes new Search Processing Language (SPL) search commands, macros, and visualizations. On top of the platform extensions meant for machine learning, the MLTK has guided modeling dashboards called Assistants. Assistants walk you through the process of performing particular analytics.
The Machine Learning Toolkit is not a default solution, but a way to create custom machine learning. You must have have domain knowledge, SPL knowledge, Splunk experience, and data science skills or experience to use the toolkit.
Types of machine learning
Machine learning is a process for generalizing from examples. You can use these generalizations, typically called models, to perform a variety of tasks, such as predicting the value of a field, forecasting future values, identifying patterns in data, and detecting anomalies from new (never-before-seen) data. Without data and correct examples, it is difficult for machine learning to work at all.
The machine learning process starts with a question. You might ask one of these questions:
- Am I being hacked?
- How hot are the servers?
- How many visits to my site do I expect in the next hour?
- What is the price range of houses in a particular neighborhood?
There are different types of machine learning, including:
Regression
Regression modeling predicts a number from a variety of contributing factors. Regression is a predictive analytic. For example, you might have utilization metrics on a machine, such as CPU percentage and amount of disk reads and writes. You can use regression modeling to predict the amount of power that that machine is likely to draw both now and in the future.
Example
... | fit DecisionTreeRegressor temperature from date_month date_hour into temperature_model
Classification
Classification modeling predicts a category or a class from a number of contributing factors. Classification is a predictive analytic. For example, you might have data on user behavior on a website or within a software product. You can use classification modeling to predict whether that customer is going to churn.
Example
... | fit RandomForestClassifier SLA_violation from * into sla_model
Forecasting
Forecasting is a predictive analytic that predicts the future of a single value moving through time. Forecasting looks at past measurements for a single value, like profit per day or CPU usage per minute, to predict future values. For example, you might have sales results by quarter for the past 5 years. Use forecast modeling to predict sales for the upcoming quarter.
Example
... | fit ARIMA Voltage order=4-0-1 holdback=10 forecast_k=10
Clustering
Clustering groups similar points of data together. For example, you might want to group customers together based on their buying behaviors, such as how much they tend to spend or how many items they buy at one time. Use cluster modeling to group together the features you specify.
Example
... | fit XMeans * | stats count by cluster
Anomaly detection
Anomaly detection finds outliers in your data by computing an expectation based on one of the machine learning types, comparing it with reality, and triggering an alert when the discrepancies between the two values is large.
Example
... | fit OneClassSVM * kernel="poly" nu=0.5 coef0=0.5 gamma=0.5 tol=1 degree=3 shrinking=f into Model_Name
How the toolkit fits into the Splunk platform
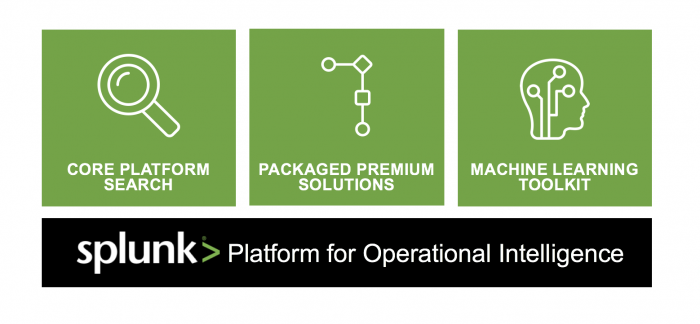
Different machine learning options exist in the Splunk platform.
- The Splunk platform has machine learning capabilities integrated in the SPL.
- Solutions including IT Service Intelligence (ITSI), Splunk Enterprise Security, and Splunk User Behavior Analytics offer managed machine learning options.
- The Machine Learning Toolkit is an app in the Splunkbase ecosystem that allows you to build custom machine learning solutions for any use case.
The machine learning process
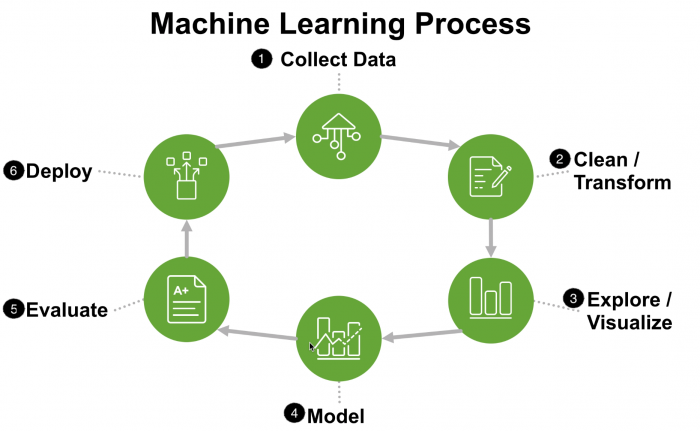
Machine learning is a process for generalizing from examples. Ideally, the machine learning process follows a series of steps, beginning collecting data and ending with deploying your machine learning model.
- Collect available data like CPU percentages, memory utilization, server temperatures, disk space, or sales values.
- Clean and transform that data. All machine learning expects a matrix of numbers as input. If you're collecting data that is missing values, then you need to clean and transform that data until it's in the form machine learning requires.
- Explore and visualize the data to make sure it is encoding what you expect it to encode.
- Build a model on training data.
- Evaluate the model test data.
- Deploy the model on un-seen data.
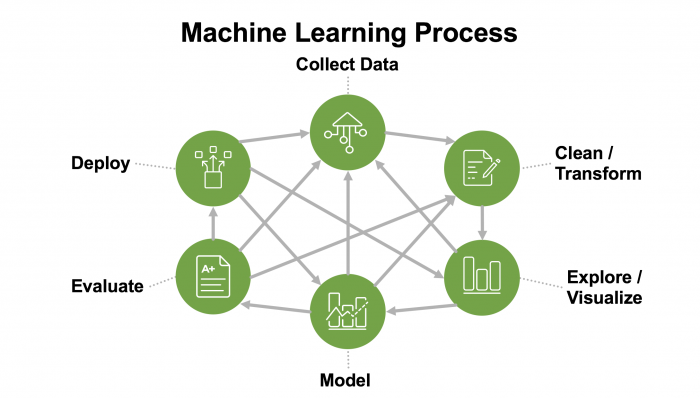
The machine learning process follows those steps in theory, but in practice it's rarely linear:
You might evaluate your model, discover the performance is not generating the results your expect, and go back to further clean and transform the data. Maybe the data has too many missing values, lacks completeness, is improperly weighted, or has unit disagreement. Iterate around the machine learning process until the model is providing desired machine learning outcomes.
The machine learning process is potentially time consuming and could mean a need for different tools, different team members, and context switching. But with the Machine Learning Toolkit, this entire process, from ingesting the data to building reports, can all occur inside the Splunk platform.
Layers that make up the Machine Learning Toolkit
The Splunk Machine Learning Toolkit is comprised of several layers, each of which aid in the process of building a generalization from your data.
Python for Scientific Computing Library
Access to over 300 open source algorithms.
The MLTK is built on top of the Python for Scientific Computing Library. This ecosystem includes the most popular machine learning library called sci-kit learn, as well as other supporting libraries like NumPy and Statsmodels.
ML-SPL API
Extensibility to easily support any algorithm, whether proprietary or open source.
The toolkit includes access to an extensibility API that not only allows you to expose the 300+ algorithms from the Python app, but also custom algorithms you can write yourself. You can share and reuse your own custom algorithms in the Splunk Community for MLTK on GitHub.
ML Commands
New SPL commands to fit, test, score, and operationalize models.
The toolkit uses the PSC app to expose new SPL commands that let you do machine learning. These are SPL commands for building (fit), testing (apply), and validating (score) models and more.
Algorithms
Over 30 standard algorithms to accommodate both supervised and unsupervised learning.
These SPL commands expose different algorithms. There are more than 3 standard algorithms, which are the most commonly used machine learning algorithms.
Showcases
Interactive examples for typical IT, security, business, and IoT use cases.
The toolkit includes many interactive examples from different domains like IoT and business analytics. This is called the Showcase. The Showcase is the initial page you land on when you open the MLTK, and it lets you see different examples from end to end.
Experiments and Assistants
Guided model building, testing, and deployment for common objectives.
On top of the tools for machine learning are guided modeling dashboards called Assistants and a management framework called Experiments. Assistants are a guided walk-through of the process for performing particular analytics with your own data. The Experiment Management Framework (EMF) brings all aspects of a monitored machine learning pipeline integrated to one interface with automated model versioning and lineage.
What is included in the toolkit
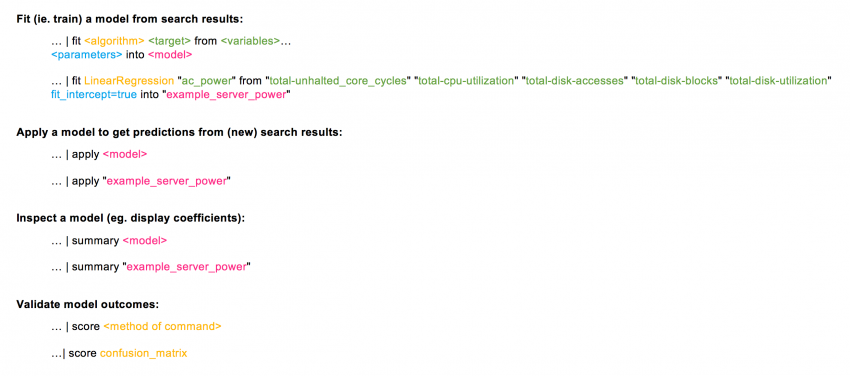
The MLTK includes several platform extensions. This includes a set of macros that allow you to compute validation statistics as well as a set of custom visualizations. The Machine Learning Toolkit provides the key commands of fit and apply:
fitbuilds the generalization or modelapplylets you use that generalization later
Commands
- fit
- apply
- summary
- listmodels
- deletemodel
- sample
- score
Macros
- regressionstatistics
- classificationstatistics
- classificationreport
- confusionmatrix
- forecastviz
- histogram
- modvizpredict
- splitby (1-5)
Visualizations
- Outliers Chart
- Forecast Chart
- Scatter Line Chart
- Histogram Chart
- Downsampled Line Chart
- Scatterplot Matrix
Other commands, including summary, listmodels, and deletemodel, manage or inspect the models you've created. The toolkit also offers the sample command that lets you take random partitions of your data. The score command is available to run statistical tests to validate model outcomes.
To learn more about the fit and apply commands, see Understanding the fit and apply commands.
To learn more about the score command see, Using the score command.
Introduction to the Assistants
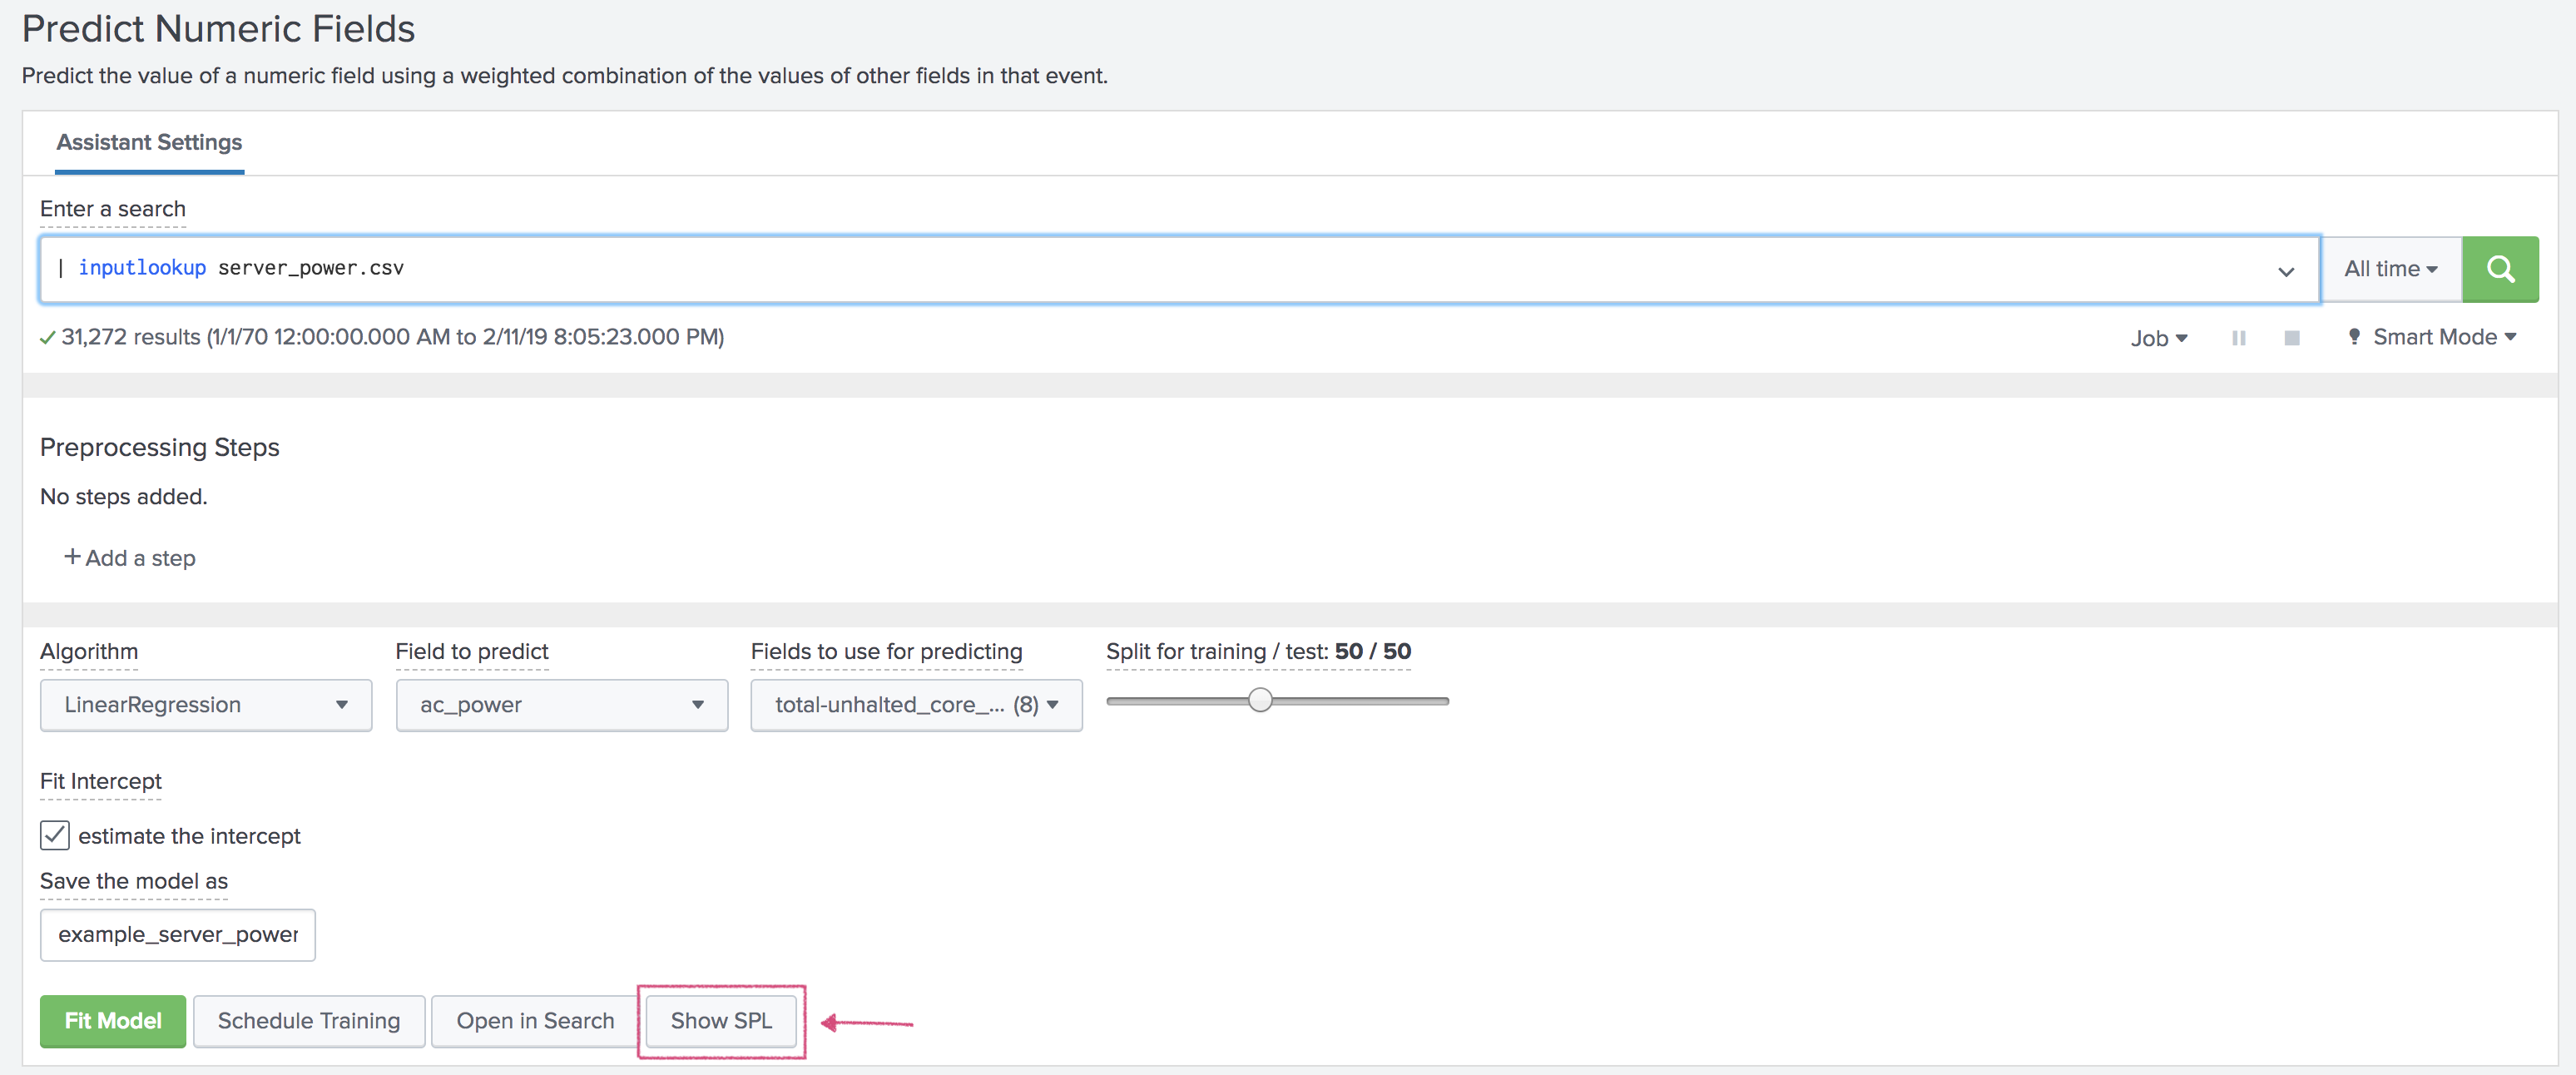
The Assistants guide you through the process of performing an analytic in the toolkit. Assistants use all tools and extensions, including both SPL and ML-SPL. You can click Show SPL at any time within an Assistant to see the SPL.
The Assistants walk you through the entire machine learning process:
- Preparing your data. Examples include replacing or computing missing values, and re-scaling fields with unit disagreement.
- Building the model.
- Validating the model. For example, when you're building a regression model, the preferred way to validate that kind of model is looking at the R2 (squared).
- Deploying the model. If you're happy with the model and want to ensure it continues to make accurate predictions, you might fit it on a schedule, and then inspect that schedule later.
Each type of machine learning has an accompanying Assistant:
| Type of machine learning | Assistant |
|---|---|
| Regression | Predict Numeric Fields Assistant |
| Classification | Predict Categorical Fields Assistant |
| Anomaly detection | Detect Numeric Outliers Assistant |
| Anomaly detection | Detect Categorical Outliers Assistant |
| Forecasting | Forecast Time Series Assistant
Smart Forecasting Assistant |
| Clustering | Cluster Numeric Events Assistant |
Learn more
Continue learning about the MLTK by working through this user guide or through the following links:
- To learn about companion apps, cheat-sheets, videos, courses, and support, see About the Machine Learning Toolkit.
- To learn about installing the Machine Learning Toolkit, see Installing the MLTK.
- To see the Assistants in action using pre-populated use cases, see the Showcase examples.
- To learn about workflow options within the MLTK, see the Splunk Machine Learning Toolkit workflow.
| New to Splunk | About the Machine Learning Toolkit |
This documentation applies to the following versions of Splunk® Machine Learning Toolkit: 4.3.0

 Download manual
Feedback submitted, thanks!