Smart Clustering Assistant
The Smart Clustering Assistant enables machine learning outcomes for users with little to no SPL knowledge. This Assistant is built on the backbone of the Experiment Management Framework (EMF), offering enhanced clustering abilities. Use the Smart Clustering Assistant to see more clustering outcomes and better understand those outcomes over the Clustering Numeric Events Assistant. The Smart Clustering Assistant offers a guided workflow that moves through stages to load data, build your model, and put that model into production. Each stage offers a data preview and visualization panel.
This Assistant leverages the K-means algorithm which persists a model using the fit command that can be used with the apply command. K-means is computationally faster than most other clustering algorithms. To learn more about the Smart Clustering Assistant algorithm, see K-means algorithm.
Smart Clustering Assistant Showcase
You can gain familiarity with this Assistant through the MLTK Showcase, accessed under its own tab. The Smart Clustering Showcase examples include:
- Cluster Houses by Property Descriptions
- Cluster Mortgage Loans

Click the name of any Smart Clustering Showcase to see this Assistant in action using pre-loaded test data and pre-selected clustering parameters.
Smart Clustering Assistant workflow
Move through the stages of Define, Learn, Review, and Operationalize to draw in data, build your model, and put that model into production.
- Select Smart Clustering from the Experiments landing page and the Create New Experiment button in the top right.
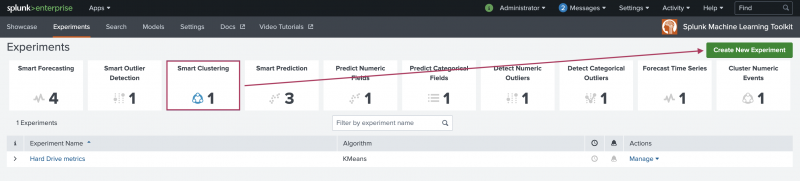
- Enter an Experiment Title, and optionally add a Description.
- Click Create to move into the Assistant interface.

Define stage
Use the Define stage to select and preview the data you want to use for the clustering.
- Select your data. You have three options to pull data into the Assistant and you can pull data in from anywhere in the Splunk platform.
Datasource option Description Search Use if your datasource is a stored dataset. You can use the Search bar to modify your dataset data in advance of using that data within the Learn step. Datasets Use to find any data you have ingested into Splunk, as well as any datasets that ship with Splunk Enterprise and the Machine Learning Toolkit. You can filter by type to find your preferred data faster. Metrics Use to find any metrics data you have gathered and stored as a custom index type without the need to write any SPL. This index might include data from systems including hosts, network devices, web servers, and SaaS systems. To learn more, see About the Splunk Metrics Workspace. - Once data is selected, the Data Preview and Visualization tabs populate.
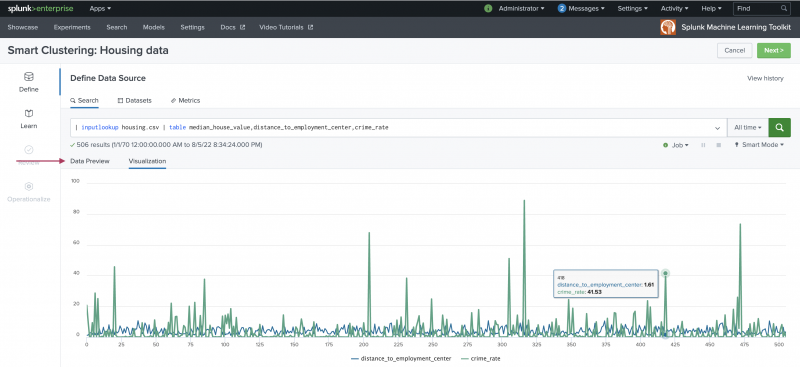
- Choose a time-range to narrow down the data time frame. The default setting of All time can be changed to suit your needs.
- When you are finished selecting your data, click Next in the top right, or Learn from the left-hand menu to move on to the next stage of the Assistant.

Learn stage
Use the Learn stage to build your clustering model. The Learn stage includes sections from which you can see the ingested data, add one or more data preprocessing steps, and pick the fields to cluster and number of clusters to generate.
- Use the +Add preprocessing section to select from one of three preprocessing algorithms.You can add multiple preprocessing steps depending on your machine learning needs.
For more detailed information on data preprocessing, see Getting your data ready for machine learning.
Refer to the following table for information on the preprocessing algorithm options and the available fields for each of those algorithms.Preprocessing algorithm Field name Field description PCA Fields to preprocess Select the fields to preprocess. Number of new fields to create Optional field. Specify the number of principal components. K new fields will be created with the prefix "PC_". KernelPCA Fields to preprocess Select the fields to preprocess. Number of new fields to create Optional field. Specify the number of principal components. K new fields will be created with the prefix "PC_". Gamma Optional field. Kernel coefficient for the rbf kernel. Tolerance Optional field. Convergence tolerance. If 0, an optimal value is chosen using arpack. Max number of iterations Optional field. If not specified, an optimal value is chosen using arpack. StandardScaler Fields to preprocess Select the fields to preprocess. For each selected field a new field will be created with the prefix "SS_". Standardize Fields Select whether to center values with respect to the mean, scale them with respect to the standard deviation or both. - Select which fields to cluster from the drop-down list. There is no limit to the number of fields you select.
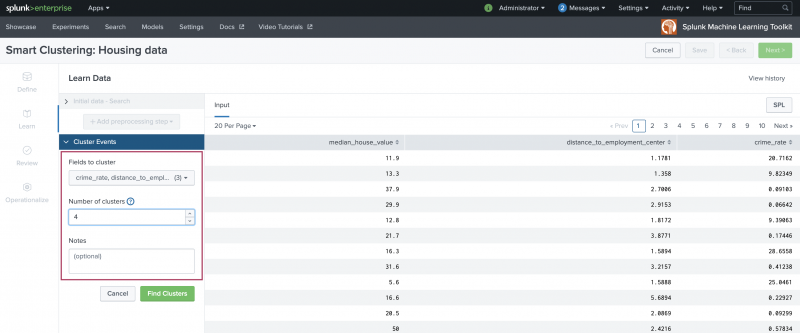
- Input the number of clusters to generate.
- Use the Notes field to track parameter adjustments you make to your Smart Clustering Experiment. Refer back to notes to review which parameter combinations yield the best results.
- Select Find Clusters when ready.
- A summary of your selected settings appears at the top of the page summarizing the generated number of clusters from which fields. The Experiment is now in a Draft state, and the View History option is available. View History allows you to track any changes you make in the Learn stage.
- The SPL button is also available as a means to review the Splunk Search Processing Language being auto generated for you in the background as you work through the Assistant, or to fit the SPL in a new search tab.
- On the resulting Evaluate tab, view your settings in a 2D or 3D scatter plot. Use the X, Y, and Z axis drop-down list to populate the scatter plots.
- Examine these scatter plots by hovering over any point or by showing/ hiding clusters by hovering over cluster numbers left hand side legend.
- Clicking a specific data points opens a New Search screen for further data examination.
- The Evaluate tab also generates and displays the Silhouette score for the model. Silhouette score measures both the distance from the cluster centroid and distance between centroids. The Silhouette score ranges from -1 to +1 with a score closer to 1 indicating a better clustering configuration.
A negative score might indicate you have selected the wrong fields to cluster by.
- When you are happy with your results, click Next in the top right, or Review from the left-hand menu to move on to the next stage of the Assistant.

Review stage
Use the Review stage to explore the resulting model based on the fields selected at the Learn stage. The Review panels give you the opportunity to assess your clustering results prior to putting the model into production.
- Use the available panels as follows:
Panel name Description Number of Clusters Use the Number of Clusters panel to review the details of cluster points across all clusters or within an individual cluster. This panel offers two tables of data, one for All Cluster Details and the other for Points in All Clusters. Use the panel filter to change the view from All Clusters to that of any of the generated clusters. Intercluster Distance Matrix Use the Intercluster Distance Matrix panel to examine the relationship between the found clusters. The panel displays the average, maximum, and minimum distances. Scroll down to view and optionally filter a bar graph display of distances between found clusters. Hover over any bar within the graph to see the specific distance value. Use the panel filter to change the view from All Clusters to that of any of the generated clusters. Intracluster Distance Distribution Use the Intracluster Distance Distribution panel to set a distance from the centroid within a cluster to find outliers. A value must be selected in order to generate a visualization. Choose to enter a value into the open field or use the available slider. Click Set Distance once a value is chosen. - Once a distance from centroid value is set you can use the panel filter to change the view from All Clusters to that of any of the generated clusters. Within the resulting visualization, hover over the cluster legend to limit the visualization to that cluster or hover over values within the visualization to view the specific distance value.
- Scroll down to see the Outlier Table for All Clusters. Use the icon beside the table name to open this view in a new tab.
- Navigate back to the Learn stage to make clustering adjustments or click Save and Next to continue.
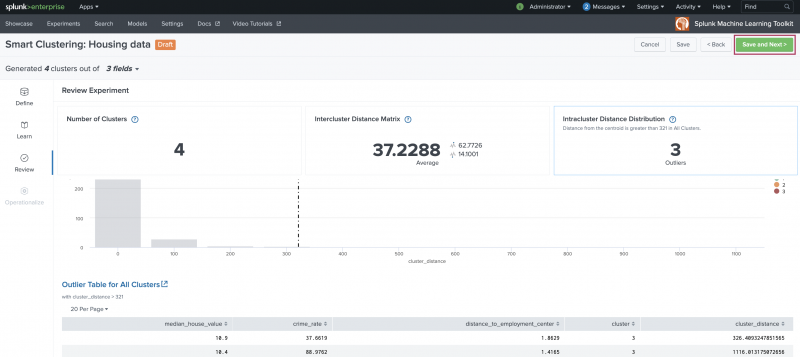
- Clicking Save and Next generates a modal window that offers the opportunity to update the Experiment name or description. When ready, click Save.

Operationalize stage
The Operationalize stage provides publishing, alerting, and scheduled training in one place. Click Done to move to the Experiments listings page.

The Experiments listing page provides a place to publish, set up alerts, and schedule training for any of your saved Experiments across all Assistant types including Smart Clustering.
Learn more
To learn about implementing analytics and data science projects using Splunk platform statistics, machine learning, and built-in and custom visualization capabilities, see the Splunk 8.0 for Analytics and Data Science course.
| Smart Outlier Detection Assistant | Smart Prediction Assistant |
This documentation applies to the following versions of Splunk® Machine Learning Toolkit: 5.3.3, 5.4.0, 5.4.1, 5.4.2, 5.5.0, 5.6.0
Feedback submitted, thanks!