Smart Forecasting Assistant
The Smart Forecasting Assistant enables machine learning outcomes for users with little to no SPL knowledge. This Assistant is built on the backbone of the Experiment Management Framework (EMF), offering enhanced time-series forecasting abilities. The Smart Forecasting Assistant provides a guided workflow that moves through stages to load data, build your model, and put that model into production. Each stage offers a data preview and visualization panel.
This Assistant leverages the StateSpaceForecast algorithm which persists a model using the fit command that can be used with the apply command. StateSpaceForecast is based on Kalman filters, supports incremental fit, and automatically imputes any missing values in your data. To help improve the accuracy of your forecast, this algorithm includes the ability to account for the effects of specific days that need to be treated differently.
To learn more about the Smart Forecasting Assistant algorithm, see StateSpaceForecast algorithm.
The Smart Forecasting Assistant supports both univariate and multivariate forecasting. Version 4.3.0 of the Smart Forecasting Assistant is limited to univariate forecasting.
Smart Forecasting Assistant Showcase
You can gain familiarity with this Assistant through the MLTK Showcase, accessed under its own tab. The Smart Forecasting Assistant Showcase examples include:
- Forecast the Number of Calls to a Call Center
- Forecast App Logons with Special Days
- Forecast App Expenses
- Forecast App Expenses from Multiple Variables

Click the name of any Smart Forecasting Showcase to see this Assistant in action using pre-loaded test data and pre-selected forecast parameters.
Smart Forecasting Assistant univariate workflow
Move through the stages of Define, Learn, Review, and Operationalize to draw in data, build your model, and put that model into production.
- Select Smart Forecasting from the Experiments landing page and the Create New Experiment button in the top right.
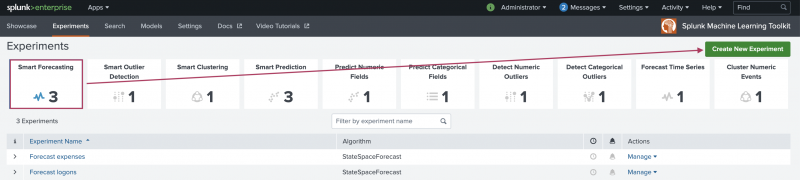
- Enter an Experiment Title, and optionally add a Description.
- Click Create to move into the Assistant interface.

Define stage
Use the Define stage to select and preview the data you want to use for the forecasting.
- Select your data. You have three options to pull data into the Assistant and you can pull data in from anywhere in the Splunk platform:
Datasource option Description Search Use if your datasource is a stored dataset. You can use the Search bar to modify your dataset data in advance of using that data within the Learn step. Datasets Use to find any data you have ingested into Splunk, as well as any datasets that ship with Splunk Enterprise and the Machine Learning Toolkit. You can filter by type to find your preferred data faster. Metrics Use to find any metrics data you have gathered and stored as a custom index type without the need to write any SPL. This index might include data from systems including hosts, network devices, web servers, and SaaS systems. To learn more, see About the Splunk Metrics Workspace. - Once data is selected, the Data Preview and Visualization tabs populate:
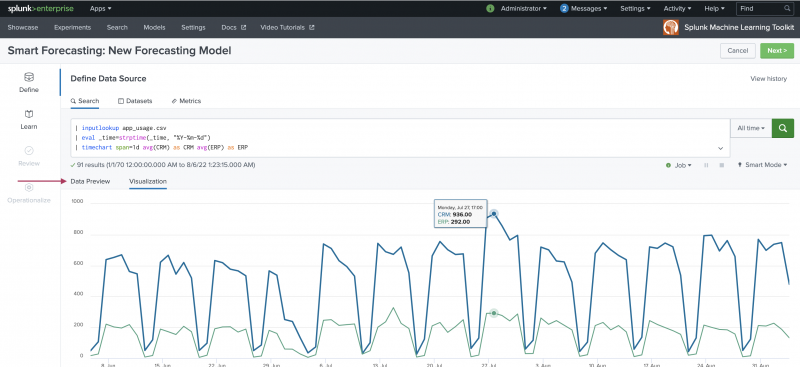
- Choose a time-range to narrow down the data time-frame to a particular date or date range. The default setting of All time can be changed to suit your needs. .
- When you are finished selecting your data, click Next in the top right, or Learn from the left-hand menu to move on to the next stage of the Assistant.

Learn stage
Use the Learn stage to perform any preprocessing on your data, and to create your forecasting model.
The Learn stage is made up of two menus: Initial data-search and Smart Forecasting. The Initial data-search menu reflects the inputs made in the Define stage. The Smart forecasting menu is where you can make selections to customize and complete the forecasting outcome.

Refer to the following table for details of each available field. Certain fields are required. Hovering over the question mark helper icons beside each field provides in-app field descriptions.
| Field name | Required or optional | Description |
|---|---|---|
| Field to forecast | Required | Select one (univariate) or more (multivariate) numeric field to forecast. You can select a maximum of five fields to forecast. |
| Holdback period | Required | Holdback is the number of data points held back from training to compare the forecast against known values. This comparison is done using R2 and RMSE statistics. |
| Future timespan | Required | Pick number of days you want to forecast into the future. The further into the future the forecast, the less accurate it is likely to be. |
| Confidence interval | Required | Specify and integer between 0 and 99, where a larger value means a greater tolerance for forecast uncertainty. Use the slider or open field to choose the value. |
| Special days field | Optional | Accessed using the Join special time entries preprocessing step. Special days data can improve your forecast by accounting for days which should be treated differently such as Black Friday sales or IP traffic on July 4th. |
| Period | Optional | Specify if the data has a known periodicity. The units of the period are equal to the span of the _time field. For example, hourly data may have a period of 24 (one day), whereas daily data may have a period of 7 (one week).
|
| Notes | Optional | Use this free form block of text to track the selections made in the parameter fields. Refer back to notes to review which parameter combinations yield the best results. |
- Select a maximum of five fields from the Fields to forecast drop-down list.
- Complete your field selections and click Forecast to view results. Clicking Forecast produces a written summary at the top of the page, moves the Experiment into a Draft state, and makes the View History option available. View History allows you to track any changes you make in the Learn stage.
- Leveraging the StateSpaceForecast algorithm provides the option to take company or business calendar specific days into account when building your forecasting model. Include these special days in your forecast using the Join special time entries preprocessing step option. For details on how to work with data from CSV lookups, see Define a CSV lookup in Splunk Web.
- The SPL button is available to review the Splunk Search Processing Language being auto-generated for you as you work through the Assistant, or to fit the SPL in a new search tab.
- Choose to make further adjustments to field settings here or click Next in the top right, or Review from the left hand menu to move on to the next stage.
Review stage
Use the Review stage to explore the resulting model based on the fields selected at the Learn stage. The Review panels give you the opportunity to assess your forecasting results prior to putting the model into production.
- Use the model statistics from R2 and RMSE to assess model accuracy and error rate. You can also choose to set a Forecasted Value date and time, an Earliest Threshold Violation alert date, as well as toggle the Confidence Interval on or off.
- Navigate back to the Learn stage to make forecast adjustments or click Save and Next to continue.
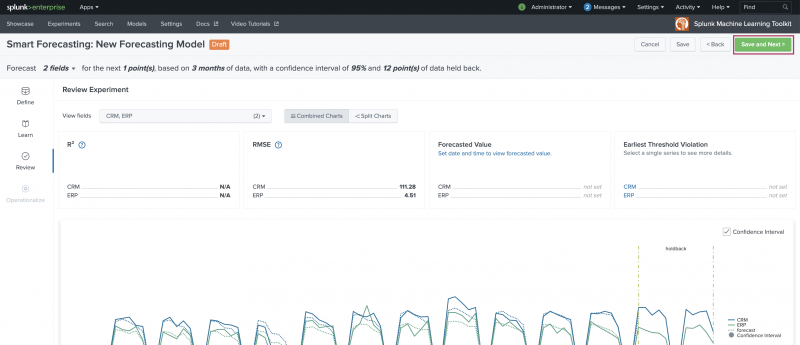
- Clicking Save and Next generates a modal window that offers the opportunity to update the Experiment name or description. When ready, click Save.

Operationalize stage
The Operationalize stage provides publishing, alerting, and scheduled training in one place. Click Done to move to the Experiments listings page.

From the Experiments listing page provides you can also publish, set up alerts, and schedule training for any of your saved Experiments across all Assistant types including Smart Forecasting.
Smart Forecasting Assistant multivariate workflow highlights
The multivariate workflow is the same as univariate in most ways. Particular screens offer some key differences associated with a multivariate workflow.
The maximum number of fields to forecast you can select for the Smart Forecasting Assistant is five.
Highlights of the multivariate workflow include the following:
| Workflow stage | Highlight |
|---|---|
| Learn stage | Field to forecast menu is a multi-pick of up to five fields. |
| The Evaluate view offers combined view of fields to forecast. | |
| Review stage | See the number of fields to forecast as well as fields by name. |
| Use the View fields menu to filter results shown. | |
| Choose to see fields in a combined or split view. | |
| Set the Earliest Threshold Violation values in one place or set individual thresholds in split view. | |
| Toggle the confidence interval on or off for the combined chart or per chart in split view. | |
| Operationalize stage | When setting Alerts, you can choose which target field to alert on, based on the fields selected when building the Experiment. |
Learn more
To learn about implementing analytics and data science projects using Splunk platform statistics, machine learning, and built-in and custom visualization capabilities, see the Splunk 8.0 for Analytics and Data Science course.
| Preprocessing | Smart Outlier Detection Assistant |
This documentation applies to the following versions of Splunk® Machine Learning Toolkit: 5.3.3, 5.4.0, 5.4.1, 5.4.2, 5.5.0, 5.6.0
Feedback submitted, thanks!