Build custom dashboards
Overview
The Splunk App for Windows Infrastructure has many dashboards which display the data that the app collects. You can also build your own panels with Dashboard Builder.
Dashboard Builder lets you design, save, and later retrieve custom dashboard panels from within the app at any time, without having to know how to build the views using XML code. You can use any dashboard panel that the Splunk App for Windows Infrastructure has available.
The Splunk App for Windows Infrastructure enables Dashboard Builder when you select "Create New Dashboard" from the Dashboard menu.
The Splunk App for Windows Infrastructure provides several pre-built dashboards. You can edit those or create and customize new ones.
View Dashboards
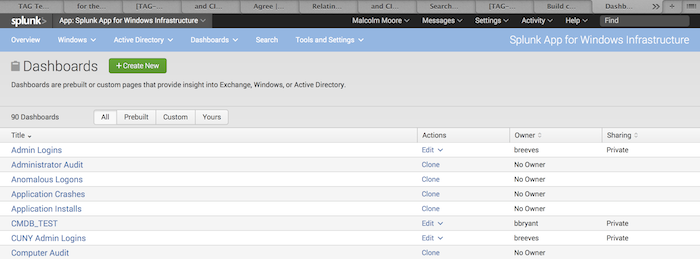
When you select "View Dashboards" from the Dashboard menu, the Splunk App for Windows Infrastructure loads the dashboards page.
The page lists all available dashboard palettes, sorted alphabetically. The page also lists the dashboard owner and the last time it was updated, and lets you make a copy of it (if it is one of the pre-built dashboards) or edit it.
To view a particular dashboard, click its name in the list. The Splunk App for Windows Infrastructure updates the screen to show you the panels that comprise the dashboard.
To edit a dashboard, click on the "Edit" link in the "Actions" column of the dashboard that you want to edit. The Splunk App for Windows Infrastructure loads the Dashboard Builder page.
Note: The action listed in the Actions column depends on whether or not the dashboard that you want to edit is a pre-built page or a page that you have created or cloned. You cannot edit the pre-built pages, you can only clone them. Once you have cloned a pre-built page, you can edit the copy as much as you want.
To create a new dashboard, click the "Create New" button on the upper left corner of the page. The Splunk App for Windows Infrastructure loads the Dashboard Builder page.
View a single dashboard
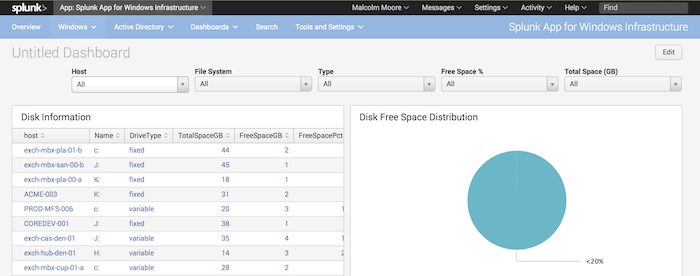
When you select a dashboard on the Dashboards page, the Splunk App for Windows Infrastructure loads the page for that dashboard.
In this view you can use the dashboard like you would any other dashboard in the Splunk App for Windows Infrastructure. You can:
- Click on links on the individual dashboards within the palette to get more information about the item you clicked.
- Filter events by using available drop-down menus or text entry boxes on a dashboard.
- Click trend lines to get more information about the events around the area you clicked.
- Sort individual lists within each dashboard by using the appropriate sorting buttons on the dashboard.
Edit dashboard
When you create a new dashboard or clone an existing one, the Splunk App for Windows Infrastructure loads the Dashboard Builder page.
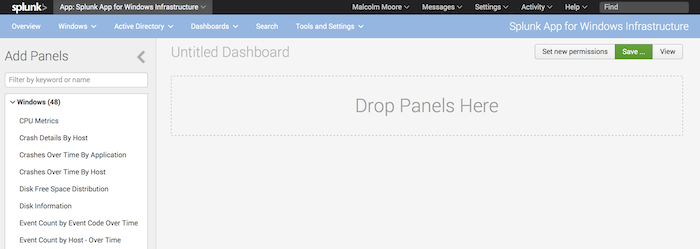
In this page, you can create custom dashboard palettes by dragging dashboard panels and dropping them into the palette view. As you add panels, you can move them around to suit your taste. Then, you can save the dashboard with a name that you will remember and retrieve it later in the "Dashboards" page.
The Dashboard Builder page has two sections:
- The "Panels" section on the left side, which lists all available panels in the Splunk App for Windows Infrastructure. It has two drop-down boxes which let you select dashboard panels for Windows or Active Directory.
- The "Drop Zone" on the right side, where you drag, drop, and arrange dashboard panels.
Create a new dashboard
To create a new dashboard:
1. Enter the Dashboard Builder page by selecting "Create New Dashboard" under the "Dashboard" menu.
2. In the Panels section, locate the dashboard panel that you want to add to the dashboard. You can do this in one of two ways:
- a. Type in the name of a panel in the text entry box above the three drop-down boxes. If you begin typing in a name, all panels that match the text you typed appear. Or,
- b. Click on one of the drop-down boxes and locate the panel in the list.
3. Once you have found the panel you want to include in the dashboard, click the panel, then drag it from the Panel window to the Drop Zone. The Splunk App for Windows Infrastructure immediately updates the dashboard with the panel you added.
Important: You must hold down the left mouse button for the entirety of the click-and-drag operation.
4. To add more dashboard panels to the palette, repeat Steps 2 and 3.
5. Once you have added the panels you want, you can then arrange them in a way that makes sense to you.
- a. Move your mouse pointer onto the top of the panel you want to move.
- b. Hold down the left mouse button and drag the panel to the place you want it to go. The Splunk App for Windows Infrastructure updates the screen and moves the Drop Zone toward this area.
- c. Once the panel is in the updated Drop Zone, release the mouse button. The Splunk App for Windows Infrastructure updates the page to reflect the rearranged panels.
Note: You can hide the Panels section to provide additional screen space to move dashboard objects around. To toggle the display of the Panels section, click the "Panels" button.
6. To remove dashboard panels that you do not want:
- a. Move your mouse pointer onto the top of the panel you want to delete.
- Each panel has a "handle bar" that lets you move the panel around. When the mouse cursor is on a handle bar, it turns into a cross shape and the handle bar activates, displaying an "X" just to the right of the panel name.
- b. Place the mouse cursor on the "X" and click once to remove the panel.
- c. Alternatively, you can remove all panels you have added by clicking Edit Details > Delete App Dashboard in the upper right corner of the page.
7. Once you have rearranged the panels, save the palette by clicking Save... in the upper right corner of the page. The Splunk App for Windows Infrastructure presents the "Save As..." dialog box.
8. Enter a title whose name you will remember in the Title field and a description of the palette in the Description field. The Splunk App for Windows Infrastructure automatically generates a palette ID that it bases on the text you entered in the "Title" field.
Note: You can override the suggested ID with an ID of your choosing by entering it into the ID field.
9. Click Save to save the palette. The Splunk App for Windows Infrastructure saves the palette and returns you to the App Palette window.
Edit an existing dashboard
To edit an existing dashboard:
1. From the Dashboards page, choose the dashboard that you want to edit and click either Edit or Clone under the Actions column. The Splunk App for Windows Infrastructure loads the Dashboard Builder window and populates the Drop Zone with the palette's existing panels.
2. Add or remove dashboard panels as desired. See "Create a new dashboard" earlier in this topic for instructions on how to add and remove individual panels. To remove all dashboard panels, click the "Edit Details > Delete App Dashboard" button at the upper right corner of the page.
3. Arrange dashboard panels as you want in the palette window.
4. If you want to change the description of the palette, click the "Edit Details" button in the upper right corner of the page, and in the pop-up menu that appears, select "Edit Description". The Splunk App for Windows Infrastructure presents the "Edit App Dashboard Details" dialog box, where you can change the name, description and ID of the dashboard palette.
4. If you want to delete the palette, click the "Edit Details" button, and in the pop-up menu that appears, click "Delete App Dashboard". The Splunk App for Windows Infrastructure asks you if you are sure that you want to delete the page. To confirm, click the "Delete" button in this dialog box.
5. If you want to clone the palette, click the "Edit Details" button, and in the pop-up menu that appears, click "Clone App Dashboard". The Splunk App for Windows Infrastructure clones the page and returns you to the App Palette window where you can edit and save changes to the cloned palette.
6. If you want to change who can see the dashboard, click the "Edit Details" button, and in the pop-up menu that appears, click "Edit Permissions". The Splunk App for Windows Infrastructure presents the "Edit Palette Permissions" page where you can configure whether or not the dashboard should display only for you (the Owner) or for anyone who has access to the app (App).
7. After you are satisfied with the changes, save the palette by clicking on the "Save" button in the upper right corner of the App Palette page.
| Build custom dashboards | Troubleshoot the Splunk App for Windows Infrastructure |
This documentation applies to the following versions of Splunk® App for Windows Infrastructure (EOL): 1.1.3, 1.2.0, 1.2.1, 1.3.0


 Download manual
Feedback submitted, thanks!