About the Splunk App for NetApp Data ONTAP
Use the Splunk App for NetApp Data ONTAP to get insight to the data that drives storage infrastructure decisions in your enterprise. The app provides visibility into your storage operations and simplifies the management and scaling of your NetApp storage infrastructure. You get fast access to data in the storage layer so that you can make mission critical decisions that impact your business applications. The app provides real-time and historical visibility into the performance and configuration of your NetApp storage infrastructure. Using the NetApp API data is collected from one or more NetApp FAS controllers.
The app provides a maintainable and scaleable solution to support the growing storage needs of your enterprise. It uses the advanced capabilities of the scheduler and the domain specific data collection nodes (DCNs) to process the data from your storage layer and map it to the app. As an administrator you want to be able to easily scale the solution to meet the demands of your business.
The scheduler
The scheduler orchestrates API data collection. Running on the Splunk search head it communicates with the worker processes on data collection nodes that perform isolated data collection tasks. The scheduler implementation is specific to the data collection configuration requirements you have for your specific domain. Data comes in and is sent using the REST API as tasks to the worker processes on the data collection nodes. The data collection nodes then executes the task and forwards the data to the Splunk indexers.
To collect data from your storage systems, you must add your data collection nodes to the scheduler's configuration. The scheduler takes the credentials for the filer and cluster assets containing the data, and the knowledge it has about what data (performance, inventory, hierarchy) to collect from the assets and sends this information to the data collection nodes. The data collection nodes now know what information they need to collect and from where they need to get it.
The scheduler manages the distribution of these data collection jobs on an interval specified in the collection configuration file on the search head. All communication is a one way street, from the scheduler to the data collection nodes. The scheduler load balances based on number of worker processes on the data collection nodes, it watches the jobs queue, and is responsible for distributing credentials to the worker nodes where they are stored locally on each node (in apps.conf). You can add or remove data collection nodes to be managed by the scheduler in the Collection Configuration Dashboard of the app. Note that the scheduler does not send data to Splunk.
The cost of running the scheduler on the search head is minimal, directly related to the network traffic as jobs are assigned. Enable remote login on Splunk forwarders. This means that you must change the default admin password or change a configuration setting to support the requirement.
The Data Collection Node
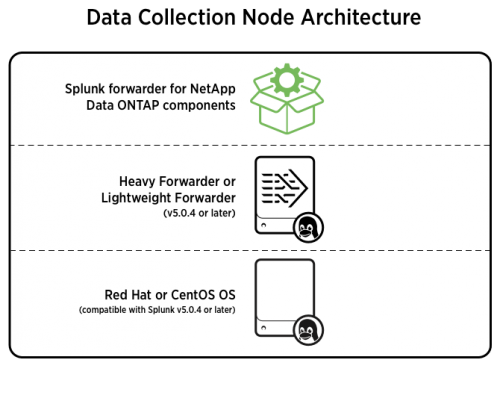
The data collection node is a Splunk light or heavy forwarder with job and process management built in. It has a copy of SA-Hydra installed on it. The data collection node manages all the data collection operations (worker processes, jobs, and sessions) for each of the storage entities from which they collect data. It also initiates log message handling (all logs are written to hydra_worker.log).
The worker processes are individual input processes declared in inputs.conf of the domain specific implementation of the hydra_worker modular input.
The worker process on the data collection nodes continually check the hydra_job.conf file for new jobs assigned to the data collection node by the scheduler. When a new job comes in, the job is claimed and executed, and then conforming to Splunk best practices it sends the output to stdout and Splunk forwarding handles the rest.
Supportability
Detailed logging is implemented as part of the scheduler management and process management. You can set individual logging levels. All of these logs go to index=_internal.
Scalability
Increased or decreased demand in data collection is met by increasing or decreasing the number of data collection node in your environment and/or increasing or decreasing the number of worker processes per data collection node.
| How this app fits into the Splunk platform picture |
This documentation applies to the following versions of Splunk® App for NetApp Data ONTAP (EOL): 2.0, 2.0.1, 2.0.2, 2.0.3

 Download manual
Feedback submitted, thanks!