Overview of the Splunk Infrastructure Monitoring Add-on
| Version | 1.2.1, 1.2.2, or 1.2.3 |
| Vendor Products | Splunk Infrastructure Monitoring |
| Add-on has a web UI | Yes |
The Splunk Infrastructure Monitoring Add-on lets a Splunk administrator collect metrics and event data from Splunk Infrastructure Monitoring. Infrastructure Monitoring is a metrics platform to address real-time cloud monitoring requirements at scale. For more information about Infrastructure Monitoring, see Introduction to Splunk Infrastructure Monitoring.
The add-on includes a Search Processing Language (SPL) command called sim that runs on the search head cluster. The sim command fetches data from your Infrastructure Monitoring organization and brings it into your Splunk environment without ingesting it into any indexes, so it doesn't affect your Splunk license. You can then leverage SPL to further manipulate and search the data.
Download the Splunk Infrastructure Monitoring Add-on from Splunkbase. To install the add-on, see Install the Splunk Infrastructure Monitoring Add-on.
See Release notes for the Splunk Infrastructure Monitoring Add-on for a summary of new features, fixed issues, and known issues.
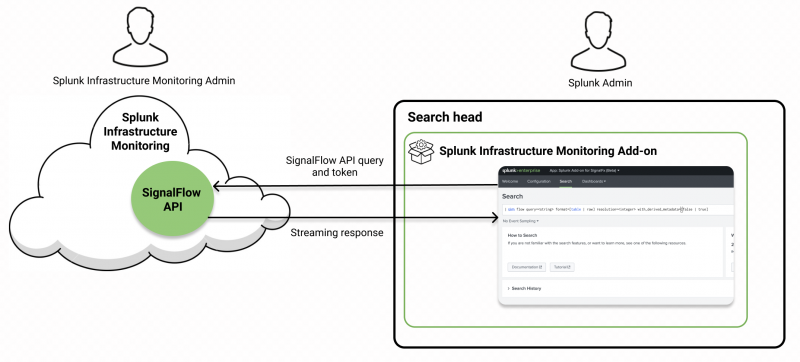
The following diagram illustrates how the add-on queries your Infrastructure Monitoring environment and streams results back to the sim_metrics metrics index:
The add-on can accept any SignalFlow API query, fetch the metrics for that query from Infrastructure Monitoring, and send it back to Splunk indexes. The following example shows the structure of the SPL search command:
| sim <subcommand> query=<signalflow query>
The following example shows an event query:
| sim event query="sf_eventCategory:ALERT"
| Release notes for the Splunk Infrastructure Monitoring Add-on |
This documentation applies to the following versions of Splunk® Infrastructure Monitoring Add-on: 1.2.1, 1.2.2, 1.2.3

 Download manual
Feedback submitted, thanks!