Charts in the Splunk Metrics Workspace
Select a source from the Data panel to view your data in a chart in the Metrics Workspace. You can either create a new chart or add additional measurements to an existing chart. Each chart contains one or more time series based on at least one aggregation. Hover over any point on the chart to see the corresponding values in the chart legend.
Charts appear in the main panel of the Metrics Workspace. The following chart shows average values for the aws.ec2.CPUUtilization, aws.ec2.NetworkIn, and aws.ec2.NetworkOut metrics.

To learn how to apply analytic operations to charts, see Analytics in the Splunk Metrics Workspace.
View charts in the workspace
View a chart in the Metrics Workspace to see your data represented as a time series.
- In the Data panel, search or browse for the data source that you want to view in a chart.
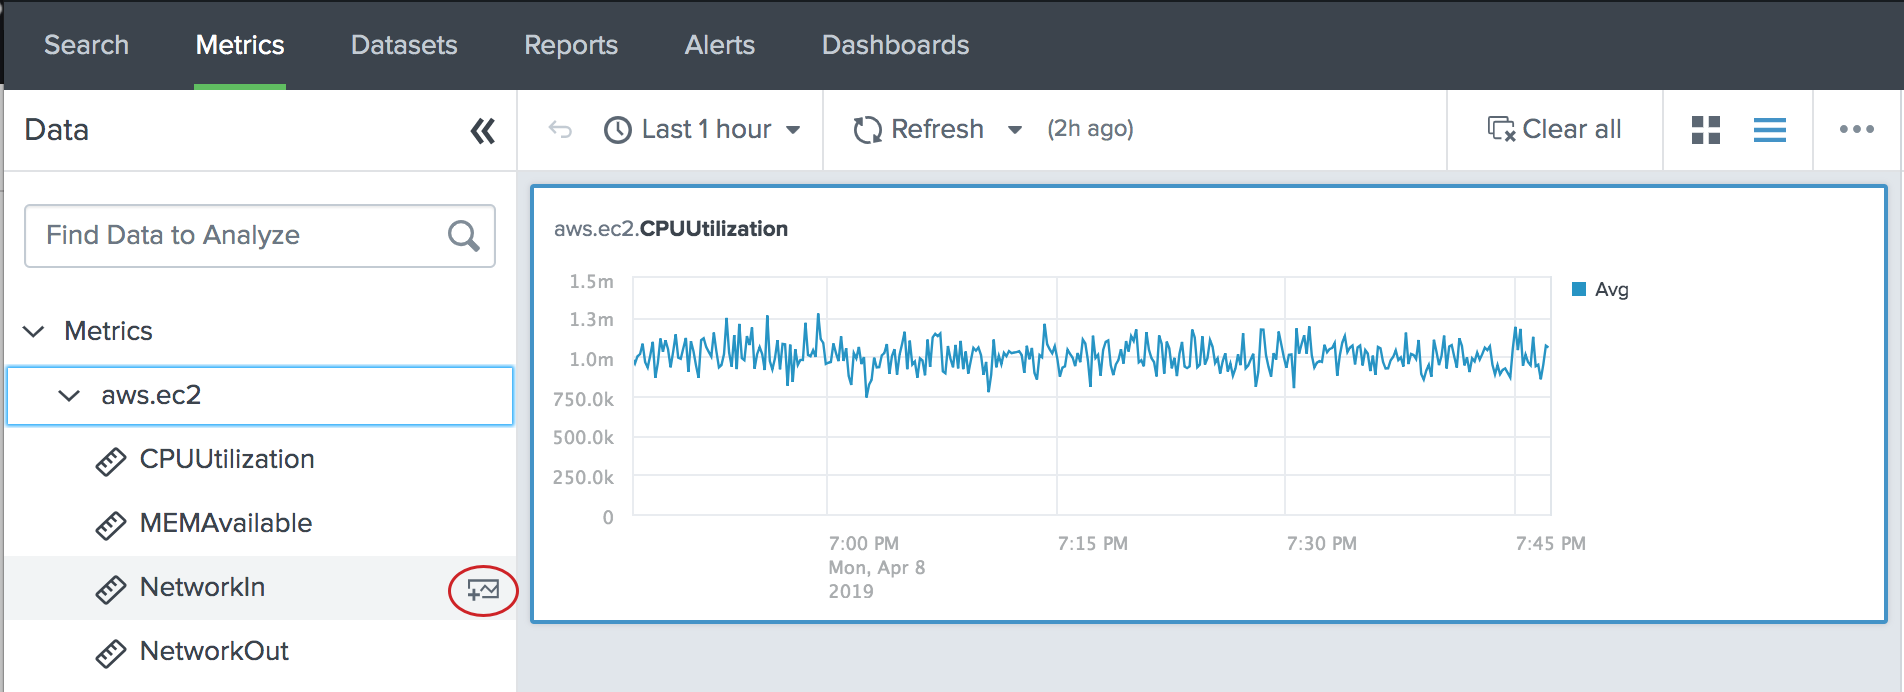
Option What to do Search for a data source In the search box, type part or all of the data source name. The list of available data sources for each data type filters to match your criteria. Browse available data sources Click the tab for the type of data that you want to visualize in the workspace. Browse through the tree of available data sources. - Select the data source you want to view as a time series.
The data source appears as a chart in the main panel of the Metrics Workspace. For example, the following chart shows the aggregate average values for the aws.ec2.CPUUtilization metric.

View multiple metrics on a chart
View multiple metrics on the same chart to see how your metrics relate to one another. You can add additional metrics to a chart to analyze correlations in your data.
- In the main panel of the Metrics Workspace, click the chart that you want to add another metric to. Your selected chart appears outlined with a blue border.
- In the Data panel, search or browse for the data source that you want to add to the chart. Supported data types for multi-series charts include metrics and datasets.
Option What to do Search for a data source In the search box, type part or all of the data source name. The list of available data sources for each data type filters to match your criteria. Browse available data sources Click the tab for the type of data that you want to visualize in the workspace. Browse through the tree of available data sources. - Hover over the data source that you want to add to the chart. The Add to selected chart (
 ) icon appears.
- Click the Add to selected chart () icon to add the data source to the chart.

The data source appears as an additional time series on your selected chart. For example, the following chart shows the aggregate average values for the aws.ec2.CPUUtilization and aws.ec2.NetworkIn metrics:

Remove a time series from a chart
Remove a time series from a chart to modify the metrics for your analysis.
- In the main panel of the Metrics Workspace, select the chart that contains the time series that you want to remove.
- In the Analysis panel, locate the name of the time series that you want to remove from the chart.
- Next to the time series name, click the X (
 ) icon.
View chart actions
Click the ellipsis (![]() ) icon in the top-right corner of a chart to view a list of chart actions.
) icon in the top-right corner of a chart to view a list of chart actions.
| Action | Description |
|---|---|
| Open in Search | Show the SPL that drives the chart's time series in the Search & Reporting App. |
| Search Related Events | View a list of log events that are related to any metric on the chart. |
| Save as Alert | Save one of the chart's time series as an alert. |
| Save as Dashboard Panel | Save the chart as a panel on a new or existing dashboard. |
| Save as Report | Save the chart as a report. Enter report details and click Save. To access the report, click the Reports tab on the Search & Reporting navigation bar. |
| Clone this Panel | Make a copy of the chart. Clone panels and then make adjustments to compare points in your data. Not available for alert panels. |
| Export as PNG | Export the chart as a PNG file. |
| Export as CSV | Export chart values as a CSV file. |
Recover workspace charts
Charts in the Metrics Workspace are automatically backed up to your local system. If you accidentally navigate away from the workspace, you have the option to restore your session in the same browser.
Disable automatic chart recovery
You also have the option to disable automatic chart recovery using the workspace.conf file.
- Navigate to the
packages/splunk_metrics_workspace/src/main/resources/splunk/defaultdirectory on your local file system. - Open
workspace.conf. - In the
featuresstanza, add the following line:state_restore = 0. - Restart Splunk Enterprise.
If you are using Splunk Cloud, you cannot disable chart recovery.
For more information about saving charts as dashboard panels, see Dashboards in the Splunk Metrics Workspace.
For more information about saving charts as alerts, see Alerts in the Splunk Metrics Workspace.
| Types of data in the Splunk Metrics Workspace | Time range in the Splunk Metrics Workspace |
This documentation applies to the following versions of Splunk® Metrics Workspace (Legacy): 1.1.6, 1.1.7, 1.1.9
Feedback submitted, thanks!