Searches power dashboards and forms
Searches generate visualizations and other content in dashboards and forms. You can also use searches to implement dynamic or interactive behavior in a dashboard.
Learn about the available search types and how to work with them in Simple XML.
Overview of search types and uses
You can use one or more search types in a dashboard depending on the content or behavior that you are creating.
Inline searches
Inline searches exist directly in a dashboard or visualization. You can create or modify inline searches when you edit dashboard panels.
Each visualization can have its own inline search. You can also use an inline search as a base search in a dashboard. Base searches require post-process searches to modify results and generate visualizations in dashboard panels.
Referenced report searches
Use a search saved as a report to generate dashboard content. Use a reference to the report to add its search and visualization to a dashboard or form.
You can edit the dashboard to adjust the visualization and time range from a referenced report. However, you cannot edit the search directly in the dashboard. Edit the report to change the search.
When you change a report search, referenced report searches in dashboards update automatically.
Searches to populate form inputs
You can use a search to generate form input choices dynamically. Indicate a results field to use for the choice labels and values that users see in the form.
Post-process searches
Post-process searches perform additional processing on results from a base search. You can use multiple post-process searches to generate different results from the same base search. You can also populate form inputs with a post-process search.
Prebuilt panels
Create a prebuilt panel if you want to reuse a search and other content. To change a prebuilt panel search, edit the prebuilt panel directly.
Changes to a prebuilt panel appear automatically in dashboards where the panel is used.
Searches generated with Pivot
You can generate pivots for export to dashboards. For more information, see Design pivot tables with the Pivot Editor in the Pivot Manual.
Create searches in Simple XML
The <search> element defines a search in Simple XML source code. Search elements include child elements, such as <query> for the search string and elements for the time range.
You can use a <search> element to define searches generating dashboard or form content. You can also use a <search> to generate form input choices or define post-process searches.
See the Simple XML Reference for more details on the the <search> element, its child elements, and usage requirements.
Examples
Inline search
Use an inline search to generate data for a visualization.
The search in this example generates data for a single value visualization showing system error counts in the last week.
In the source code for this visualization, the <search> element includes these child elements.
<query>contains the search string.<earliest>and<latest>define the search time range.
Simple XML source code
    <panel>
      <single>
        <title>Errors in the last week: single value visualization</title>

        <search>
          <!-- Search string -->
          <query>index=_internal source="*splunkd.log"
            ( log_level=ERROR OR log_level=WARN*
            OR log_level=FATAL OR log_level=CRITICAL )
            | stats count as log_events</query>

          <!-- search time range -->
          <earliest>-7d@h</earliest>
          <latest>now</latest>
        </search>

        <option name="underLabel">Errors in the last week</option>
        <option name="useColors">1</option>
      </single>
    </panel>
Referenced search from a report
Use and modify a referenced saved search to generate dashboard panel content.
Reference a saved search from a report. You can use the original time range and visualization from the report or you can modify them in Simple XML. To change the search string, edit the report.
To use a saved search in dashboard Simple XML, start by adding a ref reference attribute to the <search> element. The reference indicates the name of the report to add to the dashboard panel.
Examples
The following examples show you how to use and modify a referenced saved search in a dashboard panel.
- Reference a saved search
This dashboard panel source code includes a saved search from a report. The search time range and visualization defined in the report are not modified.<panel> <title>Referenced saved search</title> <chart> <title>Sales by product code</title> <search ref="saved_search_simple_example"> </search> </chart> </panel> - Modify the search time range
This example changes the search time range using the<earliest>and<latest>modifiers. The panel search uses the custom time range.<panel> <title>Referenced saved search with custom time range</title> <chart> <title>Sales by product code in the last week</title> <search ref="saved_search_simple_example"> <earliest>-7d@h</earliest> <latest>now</latest> </search> </chart> </panel> - Modify the visualization type
This example uses a different visualization for the search results.<panel> <title>Referenced saved search with custom time range and visualization</title> <chart> <title>Sales by product code in the last week</title> <search ref="saved_search_simple_example"> <earliest>-7d@h</earliest> <latest>now</latest> </search> <option name="charting.chart">bar</option> </chart> </panel>
Search populating a form input
Generate form input choices with a search.
You can use a search to populate choices dynamically for the following form inputs.
- Checkbox
- Dropdown
- Multiselect
- Radio buttons
Do not use a real-time search to populate form input choices. Input choices do not update as search results change.
Example
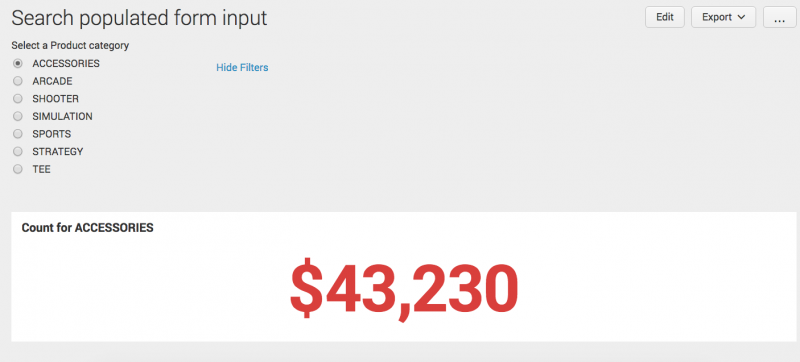
A form lets users select a product category to see the current sales total for that category.
In this Simple XML source code, the input includes a <search> element for the search that generates input choices. The fieldForLabel and fieldForValue elements indicate the results field to use for choice labels and values.
A static <intialValue> indicates an initial choice value to use before users make a selection.
When users choose a category, the input captures the selected value in the category token. The single value visualization in this form uses the token to update dynamically. The panel search includes the token value to generate results for the selected category. The token value also appears in the panel title.
<form>
  <label>Search populated form input</label>
  <fieldset autoRun="true" submitButton="false">
    <input type="radio" token="category" searchWhenChanged="true">
      <label>Select a Product category</label>
      <default>ACCESSORIES</default>
      <search>
        <query>source="/tmp/tutorialdata.zip:./www1/access.log" NOT null | stats count by categoryId</query>
        <earliest>-7d@h</earliest>
        <latest>now</latest>
      </search>
      <fieldForLabel>categoryId</fieldForLabel>
      <fieldForValue>categoryId</fieldForValue>
      <initialValue>ACCESSORIES</initialValue>
    </input>
  </fieldset>
  <row>
    <panel>
      <single>
        <title>Count for $category$</title>
        <search>
          <query>source="/tmp/tutorialdata.zip:./www1/access.log" categoryId=$category$ | stats count</query>
        </search>
        <option name="rangeValues">[0,300,700,1000]</option>
        <option name="unit">$</option>
        <option name="unitPosition">before</option>
        <option name="useColors">1</option>
      </single>
    </panel>
  </row>
</form>
Using tokens to add dynamic values to searches
Tokens are references to dynamic data, such as search result counts or user specified values. Use tokens within a search to access dynamic values and generate more customized results.
To use a token in a search, use $...$ delimiter characters around the token name. When the search runs, the $<token_name>$ is replaced with the dynamic value that it references.
Example
This search string includes the $series_tok$ token to represent a dynamic series field value. This value might come from a user selection in a form input.
index=_internal source=*metrics.log group="per_sourcetype_thruput" series=$series_tok$ | table sourcetype eps, kb, kbps
The search can generate a visualization representing the user selected $series_tok$ value.
In addition to searches, tokens can also be used to capture user input values and control dynamic dashboard behavior. See Token usage in dashboards for more details.
Post-process searches
Post-process searches perform additional processing on results from a base search. A base search can be a global search or any other search within a dashboard. Use the base attribute in a post-process <search> to indicate the base search id.
You can use a single post-process search to generate results or you can chain multiple post-process searches together.
Best practices
Use these best practices to make sure that post-process searches work as expected.
Use a transforming base search
A base search should be a transforming search that returns results formatted as a statistics table.
Non-transforming base search issues
Non-transforming base searches can cause the following search result and timeout issues. If you observe these issues in a dashboard, check the base search to make sure that it is a transforming search.
No results returned
If the base search is a non-transforming search, you must explicitly state in the base search what fields will be used in the post-process search using the | fields command. For example, if your post-process search will search for the top selling buttercup game categories over time, you would use a search command similar to the following.
| fields _time, categoryId, action
Event retention
If the base search is a non-transforming search, the Splunk platform retains only the first 500,000 events that it returns. A post-process search does not process events in excess of this 500,000 event limit, silently ignoring them. This can generate incomplete data for the post-process search.
This search result retention limit matches the max_count setting in limits.conf. The setting defaults to 500,000.
Client timeout
If the post-processing operation takes too long, it can exceed the Splunk Web client timeout value of 30 seconds.
For more information about transforming searches, see transforming commands and searches in the Search Manual.
Do not reference fields in post-process searches that are not referenced in the base search
A post-process search depends entirely on the fields present in the base search. If you are not referencing a particular field in the base search, do not reference it in the post-process search. Fields used in transforming commands will automatically be available for post-process searches. When transforming commands are not used in a base search, fields without a reference in the base search appear null in a post-process search. The post-process search returns no results in this case.
Limit base search results and post-process complexity
Passing a large number of search results to a post-process search can cause server timeout issues. In this scenario, consider adjusting the base search to reduce the number of results and fields that it returns. You can also consider reducing the complexity of post-process operations on the base search results.
Examples
The following examples show you how to use base searches and post-process searches.
Basic post-process search
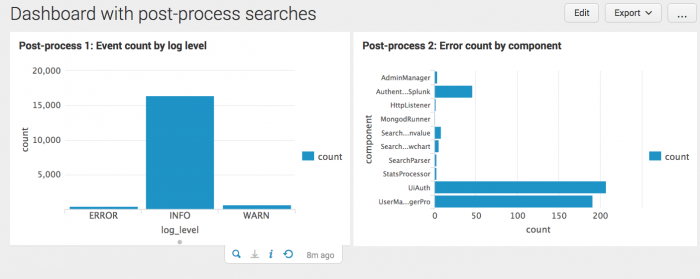
The base search in this example uses the <stats> transforming command. Two post-process searches use the base search results differently.
Base search
index=_internal source=*splunkd.log | stats count by component, log_level
First post-process search
| stats sum(count) AS count by log_level
Second post-process search
| search log_level=error | stats sum(count) AS count by component
Dashboard source code
<dashboard>
  <label>Dashboard with post-process search</label>

  <!-- Example uses stats transforming command -->
  <!-- This limits events passed to post-process search -->
  <search id="baseSearch">
    <query>
      index=_internal source=*splunkd.log | stats count by component, log_level
    </query>
  </search>

 <row>
    <panel>
      <chart>
        <title>Event count by log level</title>

        <!-- post-process search -->
        <search base="baseSearch">
          <query>
            stats sum(count) AS count by log_level
          </query>
        </search>

      </chart>
    </panel>
    <panel>
      <chart>
        <title>Error count by component</title>

        <!-- post-process search -->
        <search base="baseSearch">
          <query>
            search log_level=error | stats sum(count) AS count by component
          </query>
        </search>

        <option name="charting.chart">bar</option>
      </chart>
    </panel>
  </row>
</dashboard>
Chained post-process searches
Chain two or more post-process searches together. Start with a base search and post-process search. Use the first post-process search as the base search for another post-process search.
Dashboard source code
<search id="baseSearch">
   <query>index=_internal</query>
   <earliest>-60m@m</earliest>
   <latest>now</latest>
</search>

<search base="baseSearch" id="post_process_1">
   <query>sourcetype=splunkd</query>
</search>

<search base="post_process_1" id="post_process_2">
   <query>stats count</query>
</search>
Complex post-process search
When creating a complex base search that includes statistical aggregations such as percentiles or standard deviations, use summary indexing commands.
Summary indexing commands, such as the following commands, provide more flexibility for post-process searches.
sistatssitimechartsitopsichartsirare
For more information on summary indexing, see Use summary indexing for increased reporting efficiency and About transforming commands and searches in the Reporting Manual.
Example
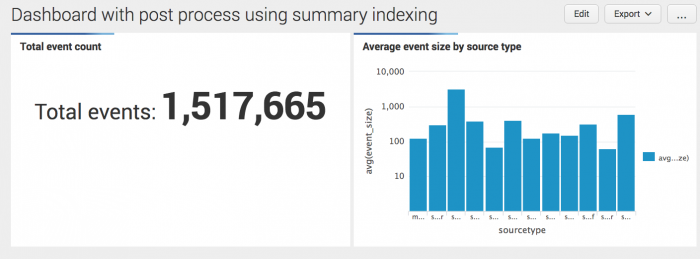
This example includes a base search using the sistats summary indexing command.
The base search reports event size (min, avg, max) by source and sourcetype for the _internal index. Use the sistats count with the various group-by clauses. You lose the benefits of map-reduce in distributed search if you do not include these.
Base search
index=_internal | eval event_size=len(_raw) <br />| sistats count min(event_size) avg(event_size) max(event_size)<br />by source sourcetype
Post process 1
| stats count
Post process 2
| stats avg(event_size) by sourcetype
Dashboard source code
<dashboard>
  <label>Dashboard with post process using summary indexing</label>

  <!-- Base search with summary indexing transforming command -->
  <search id="baseSearch">
    <query>
      index=_internal | eval event_size=len(_raw)
      | sistats count min(event_size) avg(event_size) max(event_size)
        by source sourcetype
    </query>
  </search>

  <row>
    <panel>
      <single>
        <title>Total event count</title>

        <!-- post-process search -->
        <search base="baseSearch">
          <query>stats count</query>
        </search>

        <option name="beforeLabel">Total events: </option>
      </single>
    </panel>
    <panel>
      <chart>
        <title>Average event size by source type</title>

        <!-- post-process search -->
        <search base="baseSearch">
          <query>stats avg(event_size) by sourcetype</query>
        </search>

        <option name="charting.axisY.scale">log</option>
      </chart>
    </panel>
  </row>
</dashboard>
Post-process search to populate form inputs
Use a post-process search to populate a form input
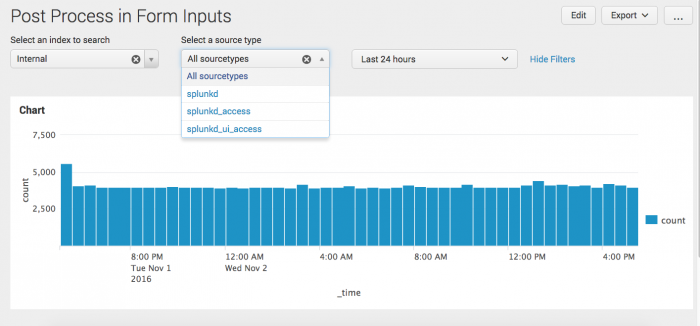
The first input in this form lets users select an index to search. This input has statically defined choices. The second input uses a post-process search to define choices dynamically.
Base search
index=_internal | stats count by sourcetype
Post process to generate input choices
| search sourcetype=splunkd*
Form source code
<form>
  <label>Post Process in Form Inputs</label>

  <!-- Global search for post process by dropdown input -->
  <search id="searchInput">
    <query>index=_internal | stats count by sourcetype</query>
    <earliest>-60min</earliest>
    <latest>now</latest>
  </search>

  <fieldset submitButton="false">

    <!-- Input with statically defined choices -->
    <input type="dropdown" token="index_tok" searchWhenChanged="true">
      <label>Select an index to search</label>
      <choice value="_internal">Internal</choice>
      <choice value="*">All public indexes</choice>
      <default>_internal</default>
    </input>

    <!-- Input with dynamically populated choices -->
    <input type="dropdown" token="sourcetype_tok" searchWhenChanged="true">
      <label>Select a source type</label>

      <!-- Default choice defined statically -->
      <choice value="*">All sourcetypes</choice>
      <default>*</default>

      <!-- Post-process search to populate additional choices -->
      <search base="searchInput">
        <query>search sourcetype=splunkd*</query>
      </search>
      <fieldForLabel>sourcetype</fieldForLabel>
      <fieldForValue>sourcetype</fieldForValue>

    </input>
    <input type="time" token="time_tok" searchWhenChanged="true">
      <label></label>
      <default>
        <earliest>-24h@h</earliest>
        <latest>now</latest>
      </default>
    </input>
  </fieldset>
  <row>
    <panel>
      <chart>
        <title>Chart</title>
        <search>
          <query>
            index=$index_tok$ sourcetype=$sourcetype_tok$ | timechart count
          </query>
          <earliest>$time_tok.earliest$</earliest>
          <latest>$time_tok.latest$</latest>
        </search>
      </chart>
    </panel>
  </row>
</form>
Panel search controls
Click refresh and stop buttons on a dashboard panel to generate new search results or stop a running search job. The stop button replaces the refresh button in the panel while a search is running. Visualizations render available results from stopped search jobs and a timestamp shows the time of the most recent job.
By default, the stop search button is visible. You can hide this button using the link.stopSearch.visible Simple XML option in your dashboard source code. See the Simple XML Reference for more details.
Stop a post-process search
Stopping a post-process search causes the base search for that post-process search to stop anywhere it is used. If the same base search is used in multiple panels, it stops in those panels too.
Troubleshoot referenced real-time searches in search head clusters
In a search head clustering (SHC) deployment, if you are referencing a real-time saved search in a dashboard on a search head, the real-time search might not continue to stream data after initial results are returned.
There are two workarounds for this issue.
| Option | Example dashboard source code | Performance considerations |
|---|---|---|
| Use an inline real-time search in the dashboard panel instead. |
<search>
    <query>index=_internal | stats count
    </query>
        <earliest>rt-5m</earliest>
        <latest>rtnow</latest>
</search>
|
This type of search runs only when users view the dashboard. However, a new real-time search spawns for each user that accesses the dashboard from the search head or another member. |
| Create a scheduled saved search. Use the loadjob command in an inline panel search to update the dashboard with the saved search results.
|
<search>
    <query> | loadjob savedsearch="admin:search:SavedSearch"
    </query>
</search>
|
Only one instance of the saved search runs at the scheduled time regardless of the number of users accessing the dashboard. |
Additional search resources
If you are new to the Splunk platform and the search processing language (SPL), start with the Search Tutorial. This tutorial introduces you to the Search and Reporting application. The tutorial guides you through adding data to your Splunk deployment, searching your data, and building simple reports and dashboards.
The Search Manual includes detailed information about creating and optimizing searches, retrieving events, specifying time ranges, and using subsearches.
The Search Reference is a reference guide for the Search Processing Language (SPL). The Search Reference contains a catalog of the search commands with syntax, descriptions, and examples.
| Editing Simple XML | Dashboards and forms |
This documentation applies to the following versions of Splunk® Enterprise: 7.0.0, 7.0.1, 7.0.2, 7.0.3, 7.0.4, 7.0.5, 7.0.6, 7.0.7, 7.0.8, 7.0.9, 7.0.10, 7.0.11, 7.0.13


 Download manual
Feedback submitted, thanks!