This topic discusses navigating the different views in Splunk Web, the Splunk web browser interface.
About Splunk Home
Splunk Home is your interactive portal to the data and apps in your Splunk deployment. The first time you log into your Splunk deployment, you land in Splunk Home. All of your apps appear on this page.
The main parts of Splunk Home include the navigation bar, the Apps menu, the Explore panel, and a custom default dashboard (not shown here).
Your Splunk account might be configured to start in another view instead of Splunk Home, such as Search or Pivot in the Search & Reporting app.
Apps panel
The Apps panel lists the apps that are installed on your Splunk instance that you have permission to view. Select the app from the list to open it. The Search & Reporting app is often referred to as Splunk Search. When you have more than one app, you can drag and drop the apps within the workspace to rearrange them.
You can perform the following actions.
- Click the gear icon to view and manage the apps that are installed in your Splunk deployment.
- Click the plus icon to browse for more apps to install.
Explore panel
The options in the Explore panel help you to get started. Click on the icons to open the Add Data view, browse for new apps, open the user documentation, or open Splunk Answers.
Home dashboard
Below the Explore panel is the home dashboard. When you first open Splunk Home, there is no default dashboard.
Click in the area labeled Choose a home dashboard to select a default dashboard.
If you are new to Splunk software, hold off selecting a default dashboard until you have created and saved a few searches. You might want to create a dashboard of your own and use that as your default dashboard.
For more information about dashboards, see the Dashboards and Visualizations manual.
About the Splunk bar
Use the Splunk bar to navigate Splunk Web. You can use it to switch between apps, manage and edit your Splunk configuration, view system-level messages, and monitor the progress of search jobs.
The following screenshot shows the Splunk bar in Splunk Home.
The Splunk bar in another view, such as the Search & Reporting app's Search view, also includes an App menu next to the Splunk logo.
Return to Splunk Home
Click the Splunk logo on the navigation bar to return to Splunk Home from any other view in Splunk Web.
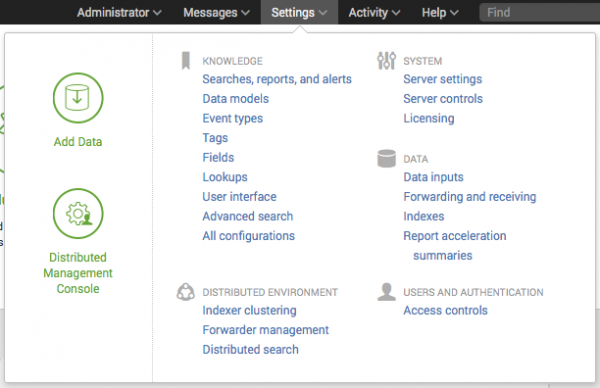
The Settings menu lists the configuration pages for Knowledge objects, Distributed environment settings, System and licensing, Data, and Authentication settings. If you do not see some of these options, you do not have the permissions to view or edit them.
Use the Account menu to edit your account settings or log out of this Splunk installation. The Account menu is called "Administrator" because that is the default user name for a new installation. You can change this display name by selecting Edit account and changing the Full name. Other settings you can edit include: the time zone settings, the default app for this account, and the account's password.
All system-level error messages are listed on the Messages menu. When there is a new message to review, a notification appears as a count next to the Messages menu. Click the X to remove the message.
The Activity menu lists shortcuts to the Jobs, Triggered alerts, and System Activity views.
- Click Jobs to open the search jobs manager window, where you can view and manage currently running searches.
- Click Triggered Alerts to view scheduled alerts that are triggered.
- Click System Activity to see Dashboards about user activity and status of the system.
Help
Click Help to see links to Video Tutorials, Splunk Answers, the Splunk Support Portal, and online Documentation.
Find
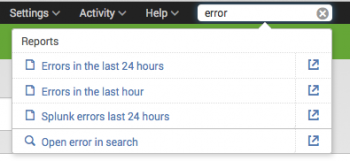
Use Find to search for objects within your Splunk deployment. Find performs matches that are not case sensitive on the ID, labels, and descriptions in saved objects. For example, if you type "error", it returns the saved objects that contain the term "error".
These saved objects include Reports, Dashboards, Alerts, and Data models. The results appear in the list separated by the categories where they exist.
You can also run a search for error in the Search & Reporting app by clicking Open error in search.
See also
| Get started with Search | About the search language |
This documentation applies to the following versions of Splunk® Enterprise: 7.0.0, 7.0.1, 7.0.2, 7.0.3, 7.0.4, 7.0.5, 7.0.6, 7.0.7, 7.0.8, 7.0.9, 7.0.10, 7.0.11, 7.0.13


 Download manual
Feedback submitted, thanks!