About uploading data
When you add data to your Splunk deployment, the data is processed and transformed into a series of individual events that you can view, search, and analyze.
What kind of data?
The Splunk platform accepts any type of data. In particular, it works with all IT streaming and historical data. The source of the data can be event logs, web logs, live application logs, network feeds, system metrics, change monitoring, message queues, archive files, and so on.
In general, data sources are grouped into the following categories.
| Data source | Description |
|---|---|
| Files and directories | Most data that you might be interested in comes directly from files and directories. |
| Network events | The Splunk software can index remote data from any network port and SNMP events from remote devices. |
| Windows sources | The Windows version of Splunk software accepts a wide range of Windows-specific inputs, including Windows Event Log, Windows Registry, WMI, Active Directory, and Performance monitoring. |
| Other sources | Other input sources are supported, such as FIFO queues and scripted inputs for getting data from APIs, and other remote data interfaces. |
For many types of data, you can add the data directly to your Splunk deployment. If the data that you want to use is not automatically recognized by the Splunk software, you need to provide information about the data before you can add it.
Let's look at some of the data sources that are automatically recognized.
Splunk Cloud
- If the Welcome to the Splunk Free Cloud Trial! window is displayed, close the window.
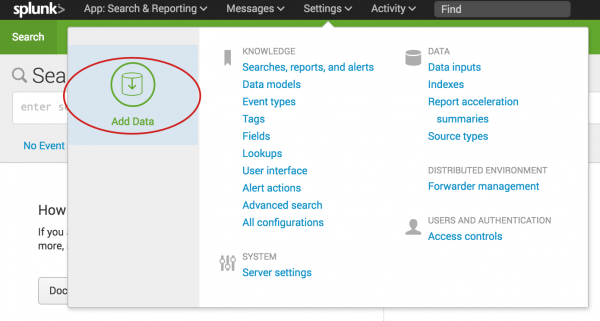
- On the Splunk bar, click Settings > Add Data.
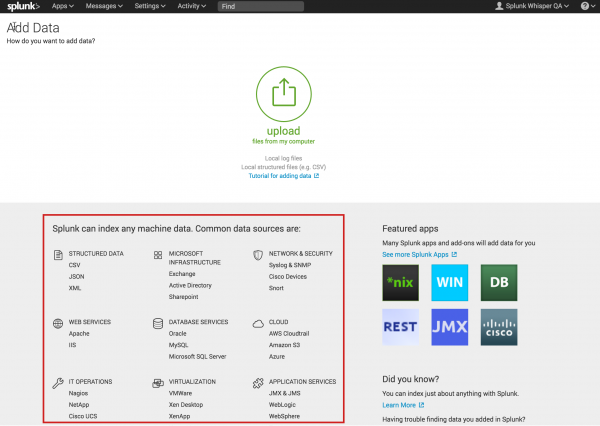
- At the bottom of the screen is a list of common data sources.
- You will come back to this window in a moment.
- Click the Splunk logo to return to Splunk Home.
Splunk Enterprise
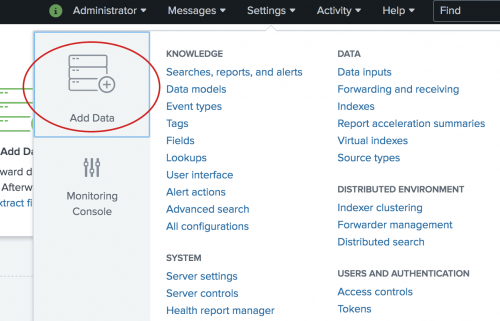
- On the Splunk bar, click Settings > Add Data.
- Scroll down and look at the list of common data sources.
You will come back to this window in a moment. - Click the Splunk logo to return to Splunk Home.
Where is the data stored?
The process of transforming the data is called indexing. During indexing, the incoming data is processed to enable fast searching and analysis. The processed results are stored in the index as events.
The index is a flat file repository for the data. For this tutorial, the index resides on the computer where you access your Splunk deployment.
Events are stored in the index as a group of files that fall into two categories:
- Raw data, which is the data that you add to the Splunk deployment. The raw data is stored in a compressed format.
- Index files, which include some metadata files that point to the raw data.
These files reside in sets of directories, called buckets, that are organized by age.
By default, all of your data is put into a single, preconfigured index. There are several other indexes used for internal purposes.
Next step
Now that you are more familiar with data sources and indexes, let's learn about the tutorial data that you will work with.
See also
Use apps to get data into the index in Getting Data In
About managing indexes in Managing Indexers and Clusters of Indexers
| Navigating Splunk Web | What is in the tutorial data? |
This documentation applies to the following versions of Splunk® Enterprise: 7.1.0, 7.1.1, 7.1.2, 7.1.3, 7.1.4, 7.1.5, 7.1.6, 7.1.7, 7.1.8, 7.1.9, 7.1.10, 7.2.0, 7.2.1, 7.2.2, 7.2.3, 7.2.4, 7.2.5, 7.2.6, 7.2.7, 7.2.8, 7.2.9, 7.2.10, 7.3.0, 7.3.1, 7.3.2, 7.3.3, 7.3.4, 7.3.5, 7.3.6, 7.3.7, 7.3.8, 7.3.9


 Download manual
Feedback submitted, thanks!