Manage token values in the current dashboard
Use drilldown to update token values and trigger responsive behaviors in the current dashboard. Instead of linking to a search or another dashboard, you can build a drilldown that manages token values when users click an element in the dashboard. Depending on the dashboard configuration, these token value changes can prompt different dynamic behaviors in it.
How managing token values works
Managing token values is part of creating responsive drilldown behavior in the current dashboard. Before you configure token value updates in the drilldown, plan the behavior that you want in the dashboard. For example, you can show or hide content on a user click. You can also <set> a token value that is part of a search string to generate a more customized visualization in the dashboard.
In the drilldown, you can set, unset, or use eval to change token values on a user click. Setting or updating token values does not result in dynamic dashboard behavior by itself. To create responsive changes, you configure elements in the dashboard to listen for these token updates.
As an example, you might want to show a relevant panel when a user clicks on a particular table in your dashboard. You can use the drilldown editor or Simple XML to configure a drilldown in this table to set the custom show_content token. You can then edit the dashboard source code to add a depends attribute to the panel so that it displays only if the show_content token is set.
The use cases and examples in this topic show you different options for responsive behavior in the current dashboard.
Manage and respond to token values in the drilldown editor and Simple XML
You can use the drilldown editor to set, unset, or eval token values. After creating these configurations, you can use Simple XML to set up responses to the token values in the same dashboard.
Prerequisites
- Before changing token values, plan the responsive behavior that you want in the current dashboard. Typically, you create or use existing tokens whose values you
set,unset, andevalin a drilldown to invoke responsive behavior. Make sure that tokens are available and placed to configure the behavior that you want. You can create new tokens or reference tokens in dashboard elements as needed.
- Some default drilldown settings are new as of version 6.6.0. Review drilldown defaults and customization in Use drilldown for dashboard interactivity.
Steps
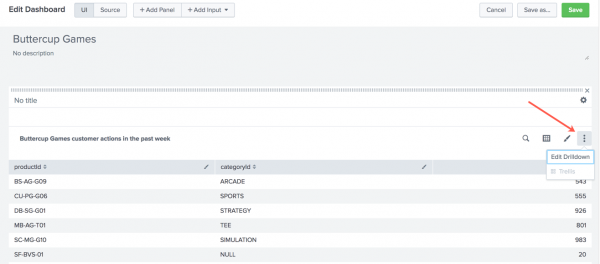
- From the dashboard where you want to configure drilldown, click Edit to open the dashboard editor.
- Find the panel where you are configuring drilldown. Click the additional options button and select Edit drilldown.
- Select Manage token values on this dashboard.
- Select and configure token actions. You can include one or more token actions in the drilldown.
- To
seta token, type the token name and new value to set. - To
evala token value, type the token name and the eval expression that determines the token value. - To
unset, or remove, a token value, type the token name.
- To
- Click Apply to apply the drilldown settings.
- Click Source to open the source code editor.
- Use Simple XML to configure the behavior responding to the token value updates. For example, use the
dependspanel attribute to make a token setting determine whether a panel displays. - Click Save to save your dashboard changes.

Manage and respond to token values in Simple XML
You can use Simple XML to manage and respond to token values. Before configuring the token value changes, plan the responsive behavior that you want in the current dashboard. Check your dashboard source code to make sure that the tokens that you need are available. You can create or edit tokens to work with the behavior you are building.
As an example, if you want to show customized visualization content, make sure that the search string driving the visualization includes a token that you can use to customize results. You can configure the drilldown to <set> that token so that the search filters for a set value.
Example visualization search string with a token to filter results
index = _internal | stats count by $count_field$
Example drilldown to set this token to a clicked field name
This drilldown uses the predefined $click.value$ token to capture the clicked value. It sets the custom $count_field$ token to that value. The search string can then filter results for the clicked field.
<drilldown>
    <set token="count_field">$click.value$</set>
</drilldown>
Configuration details
From the dashboard where you are enabling drilldown, click Edit to open the dashboard editor and select Source to access the dashboard source code.
Find the element where you are adding or updating drilldown. Add a <drilldown> element and set, unset, or eval child elements to configure how token values change on a user click.
See the following examples for more details on creating responsive behavior in Simple XML.
Generate customized content
You can use token updates to generate customized content when a user clicks a dashboard element. For example, use tokens in a search string to show a visualization that reflects clicked values.
Example
A Choropleth map shows recent sales activity in the United States. When users click on a state, a single value visualization shows users a sales total for the selected state.
This screenshot shows the dashboard after the user clicks on California in the Choropleth map.

Configuring the dynamic behavior
When a user clicks on a state in the map, a token is set. The token captures the selected state value.
The token representing the clicked state on the map is used in the single value search string to filter results. The search generates a visualization specific to the selected state.
Dashboard source code
In the Choropleth map, a <drilldown> sets the selected_state token to the clicked location.
<map>
    <title>Sales events in the United States this week
    </title>
    [...]
    <drilldown>
      <set token="selected_state">$click.value$</set>
    </drilldown>
    [...]
</map>
In the same dashboard, the single value search uses this token to generate a sales total for the selected state. This search is similar to the one driving the Choropleth map, but it filters and aggregates events using the selected_state value.
The single value <title> also uses the selected state token.
<single>
    <title>Sales events for $selected_state$
    </title>
    [...]
    <search>
      <query>source="my_data_source" | iplocation IP | lookup geo_us_states longitude as lon, latitude as lat | search featureId=$selected_state$| stats count</query>
      <earliest>-7d@h</earliest>
      <latest>now</latest>
      <sampleRatio>1</sampleRatio>
    </search>
[...]
</single>
Show or hide content
To show or hide content on a user click, use the tokens that you are updating in depends or rejects attributes in dashboard elements. These attributes let you control show or hide behavior when the tokens are set or unset.
Hiding an element does not stop any search elements from running in the background.
Configuring dynamic display
You might want to show a panel only when users click on an element in a dashboard. Add a depends attribute to the panel in order to require the show_panel token to be set for the panel to display.
<panel depends="$show_panel$">
Use a contextual drilldown to <set> the show_panel token when a user clicks on an element in the dashboard.
<drilldown>
    <set token="show_panel">true</set>
</drilldown>
Prior to the the click event, the token is unset and the panel does not display. When the user clicks on the element where the contextual drilldown is configured, the show_panel token is set and the panel displays.
Example
This dashboard shows a table with event counts by sourcetype. When users click on a particular table row, an additional visualization appears. The visualization shows events for the selected sourcetype.
This screenshot shows the dashboard after the user clicks the splunkd_conf sourcetype in the table.

Controlling panel display
The dynamic behavior in this example includes showing a panel and generating customized search results when users click a table row.
To start, the <drilldown> sets a token for controlling panel display . The events list panel uses a depends attribute to require the show_panel to be set for the panel to appear.
Customizing the dashboard content
Setting a token in the <drilldown> also helps to generate custom content in the dashboard. In this example, the selected_value token is set to the clicked sourcetype value.
The search driving the events list visualization uses the selected_value token to generate results for the clicked sourcetype value. The panel title is also customized using the selected_value token.
Dashboard source code
<dashboard>
  <row>
    <panel>
      <table>
        <title>Event counts by sourcetype</title>
        <search>
          <query>index=_internal | stats count by sourcetype</query>
        </search>
        <drilldown>
          <set token="show_panel">true</set>
          <set token="selected_value">$click.value$</set>
        </drilldown>
      </table>
    </panel>
    <panel depends="$show_panel$">
      <event>
        <title>Recent events for $selected_value$</title>
        <search>
          <query>index=_internal sourcetype=$selected_value$ </query>
          <earliest>$earliest$</earliest>
          <latest>$latest$</latest>
        </search>
        <option name="count">5</option>
      </event>
    </panel>
  </row>
</dashboard>
Configure conditional behavior
You might want to show different dashboard content depending on which element or value a user clicks. You can use <condition> elements inside the <drilldown> to define conditional token setting. This can help you to customize responsive behavior in the dashboard.
Example
A table shows event counts by sourcetype and log_level.

If a user clicks on a sourcetype value in the table, the dashboard shows a single value aggregating events for the selected sourcetype.

If a user clicks on a log_level value, an events list for the selected logging level appears.

Setting up the conditional drilldown behavior
The contextual <drilldown> includes <condition> elements to set token values differently depending on where users click.
To handle the different click locations, there is a <condition> element for each field, or column, in the table. For example, this <condition> defines token setting if a user clicks on a value in the sourcetype column.
<condition field="sourcetype">
    <set token="selected_sourcetype">$click.value2$</set>
    <set token="show_single_value">true</set>
    <unset token="show_event_list"></unset>
</condition>
The drilldown actions in this <condition> set up conditional content customization and display.
| Conditional behavior | Source code in the <condition>
|
Details |
|---|---|---|
| Generate customized search results | <set token="selected_sourcetype">$click.value2$ </set> |
The selected_sourcetype token value represents the clicked sourcetype.The $click.value2$ predefined token captures the clicked table cell value. The token value is part of a search generating a customized visualization.
|
| Control panel display | <set token="show_single_value">true </set> <unset token="show_event_list"> </unset> |
To control which panels display when users click a sourcetype, set the show_single_value token and <unset> the show_event_list. Combined with depends attributes, these token updates trigger responsive hide and show behavior.
|
The <condition> configured to handle user clicks in the log_level column is similar.
Dashboard source code
<dashboard>
  <label>Contextual drilldown</label>
  <row>
    <panel>
      <table>
        <title>Event counts by sourcetype and log level</title>
        <search>
          <query>index=_internal | stats count by sourcetype, log_level</query>
        </search>
        <drilldown>
          <condition field="sourcetype">
            <set token="selected_sourcetype">$click.value2$</set>
            <set token="show_single_value">true</set>
              <unset token="show_event_list"></unset>
          </condition>
          <condition field="log_level">
            <set token="selected_log_level">$click.value2$</set>
            <set token="show_event_list">true</set>
             <unset token="show_single_value"></unset>
          </condition>
        </drilldown>
      </table>
    </panel>
  </row>
  <row>
    <panel depends="$show_single_value$">
      <title>Event count for $selected_sourcetype$</title>
      <single>
        <search>
          <query>index=_internal sourcetype=$selected_sourcetype$ | stats count</query>
        </search>
        <option name="colorMode">block</option>
        <option name="drilldown">all</option>
        <option name="rangeColors">["0x65a637","0x6db7c6","0xf58f39","0xd93f3c"]</option>
        <option name="rangeValues">[0,30,100]</option>
        <option name="underLabel">events</option>
        <option name="useColors">1</option>
      </single>
    </panel>
    <panel depends="$show_event_list$">
      <title>Last five events with log level $selected_log_level$</title>
      <event>
        <option name="count">5</option>
        <search>
          <query>index=_internal log_level=$selected_log_level$</query>
        </search>
      </event>
    </panel>
  </row>
</dashboard>
| Link to a URL | Token usage in dashboards |
This documentation applies to the following versions of Splunk® Enterprise: 7.1.0, 7.1.1, 7.1.2, 7.1.3, 7.1.4, 7.1.5, 7.1.6, 7.1.7, 7.1.8, 7.1.9, 7.1.10, 7.2.0, 7.2.1, 7.2.2, 7.2.3, 7.2.4, 7.2.5, 7.2.6, 7.2.7, 7.2.8, 7.2.9, 7.2.10, 7.3.0, 7.3.1, 7.3.2, 7.3.3, 7.3.4, 7.3.5, 7.3.6, 7.3.7, 7.3.8, 7.3.9, 8.0.0, 8.0.1, 8.0.2, 8.0.3, 8.0.4, 8.0.5, 8.0.6, 8.0.7, 8.0.8, 8.0.9, 8.0.10, 8.1.0, 8.1.1, 8.1.2, 8.1.3, 8.1.4, 8.1.5, 8.1.6, 8.1.7, 8.1.8, 8.1.9, 8.1.10, 8.1.11, 8.1.12, 8.1.13, 8.1.14, 8.2.0, 8.2.1, 8.2.2, 8.2.3, 8.2.4, 8.2.5, 8.2.6, 8.2.7, 8.2.8, 8.2.9, 8.2.10, 8.2.11, 8.2.12
Feedback submitted, thanks!