Format table visualizations
Use the Format menu to configure a table visualization.
Add summary statistics
Use the Format menu Summary tab to include column totals and percentages. For each statistic, a highlighted summary row appears at the bottom of the table. Column totals and/or percentages appear at the bottom of each column that contains numeric values.
Note: Values in a summary row reflect statistics for the complete search result set. For tables with more than one page of results, summary row values do not apply only to the currently displayed page.
Summary and data row differences
There are some behavior and formatting differences between summary rows and data rows in a table.
| Behavior or format | Summary rows | Data rows |
|---|---|---|
| Static highlight color | Yes | No |
| Values in the row can skew table color formatting or data overlay | No | Yes |
| Column number formatting applied to the row | Yes | Yes |
| Drilldown available for the row | No | Yes |
| Included in PDF or CSV export | No | Yes |
Totals data row behavior
A static summary row fits most use cases. If you generate a totals data row using the addcoltotals SPL command in a search, note the following table behavior impacts.
- An
addcoltotalsrow is treated as a data row in the table. - Because they are handled as data rows,
addcoltotalsrows are included in a PDF or CSV dashboard export. - Color scales or data overlay can be skewed if a table includes an
addcoltotalsdata row. - Tables should not include an
addcoltotalsdata row and a column totals summary row. If you opt to include a totals summary row, adjust the search to remove theaddcoltotalscommand.
Summary row examples
The following examples show use case scenarios for adding column totals and percentage rows to a table.
Totals summary row
An analyst for an online retailer is evaluating how customer actions, such as purchases or quantity changes, relate to product types. The analyst is also comparing the relative frequency of different customer actions.
The following query generates a table showing product type counts for each customer action.
... | chart count(itemId) over categoryId by action
Using the Format menu, the analyst adds a totals summary row to the table.
The totals row shows relative totals for each customer action. For instance, there were 2634 purchase events in the results set, compared to 276 product removal events.
Percentage summary row
An analyst creates a table showing purchasing activity on a retail website. The following query generates results comparing purchases for different product types.
... | chart count(itemId) over action by categoryId
The analyst uses the Format menu to include a percentage row in the table.
This row shows a percentage for each product type relative to all purchases. For example, arcade games make up 9.5 percent of all purchases.
Format table columns
You can format individual table columns to add context or focus to the visualization. Click on the paintbrush icon at the top of each column to customize color and number formatting.
Note: Column formatting is not available for columns representing the _time field or for sparkline columns.
Column color
Select and configure one of the following color modes for the column.
Note: Column color formatting overrides existing heat map or high/low value data overlay settings.
Scale
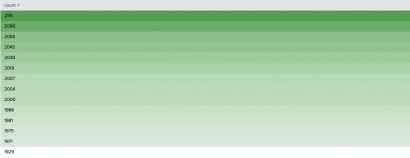
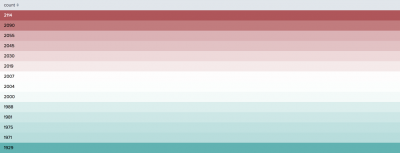
Use a sequential or divergent color scale on column cells. You can choose a preset scale or a custom configuration to manage how colors in the scale are applied to column cells.
Depending on search results and data distribution, column color gradation can vary. Columns with relatively similar values will show the most color gradation. Outlying values can limit the gradation.
Color scale options
Configure a custom color scale
You can configure custom color handling by indicating minimum, midpoint, and maximum value colors. Use one of the following options to configure the minimum, midpoint, and maximum value interpretation for the color scale.
Configuration options
| Option | Description | Use case example |
|---|---|---|
| Highest and lowest values | This option highlights the highest and lowest values in the column. |
|
| Number | Indicate numeric value thresholds. Cell color is determined according to how values align with the three thresholds. |
|
| Percent | Determine cell color using percentages of the results value range. |
|
| Percentile | Determine cell color using percentiles of the results value distribution. |
|
Ranges
Apply color to cells in this column according to value ranges.
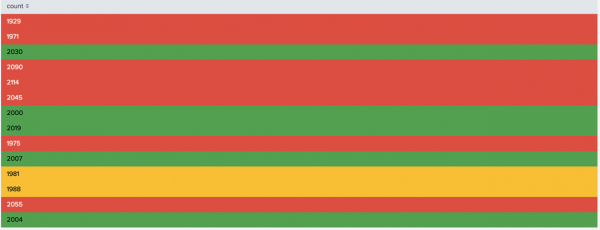
Use ranges to compare cell values categorically. For example, use red, yellow and green range colors to indicate low, medium, and high sales results.
Range configuration options:
- Adjust the default range value and color settings.
- Add or remove ranges.
Values
Apply colors according to cell values.
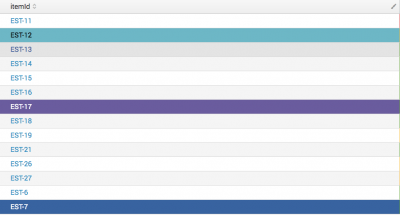
Use automatic value coloring or define custom rules. Automatic coloring applies a color to every cell in the column. Cells with the same value appear in the same color.
Custom rules can help highlight specific values that you are monitoring. For example, use custom rules to highlight three new products in recent sales data.
Number format
Enable and adjust number formatting for each column. The number format settings panel includes the following options.
- Enable or disable number formatting.
- Set decimal precision.
- Opt to use thousand separators.
- Specify a measurement unit to add context to the values in this column. You can position the unit before or after each value.
Configure table properties
After generating a table, use the Format menu to configure one or more of the following table components.
- The number of rows shown in each table page
- Wrapping
- Table row number display
Data overlay
The Format menu also includes the following data overlay options.
Heat map
Add different shades of a particular color to the table to show value variation over table rows.
High and low value
Add high and low value colors to the table to highlight the highest and lowest values.
Use data overlay only if you are not adding column color formatting to the table. Column color formatting overrides data overlay configurations.
Drilldown
By default, drilldown is disabled when you save visualizations to a dashboard. You can use the drilldown editor or Simple XML to enable and configure drilldown options. For example, use drilldown to link to Splunk Answers posts relevant to the value users click in a table cell. See Use drilldown for dashboard interactivity for more details on enabling and configuring drilldown.
Simple XML drilldown options
In Simple XML, you can set the drilldown option to one of the following values. Use the <drilldown> element to change the drilldown behavior.
| Option | Behavior |
|---|---|
| Cell | By default, opens a secondary search using the field and value in the selected cell. |
| Row | By default, opens a secondary search using the field and values from cells in the selected row. |
| None | Disables drilldown. |
| Generate a table | Table column Simple XML |
This documentation applies to the following versions of Splunk® Enterprise: 7.1.0, 7.1.1, 7.1.2, 7.1.3, 7.1.4, 7.1.5, 7.1.6, 7.1.7, 7.1.8, 7.1.9, 7.1.10, 7.2.0, 7.2.1, 7.2.2, 7.2.3, 7.2.4, 7.2.5, 7.2.6, 7.2.7, 7.2.8, 7.2.9, 7.2.10, 7.3.0, 7.3.1, 7.3.2, 7.3.3, 7.3.4, 7.3.5, 7.3.6, 7.3.7, 7.3.8, 7.3.9, 8.0.0, 8.0.1, 8.0.2, 8.0.3, 8.0.4, 8.0.5, 8.0.6, 8.0.7, 8.0.8, 8.0.9, 8.0.10, 8.1.0, 8.1.1, 8.1.2, 8.1.3, 8.1.4, 8.1.5, 8.1.6, 8.1.7, 8.1.8, 8.1.9, 8.1.10, 8.1.11, 8.1.12, 8.1.13, 8.1.14, 8.2.0, 8.2.1, 8.2.2, 8.2.3, 8.2.4, 8.2.5, 8.2.6, 8.2.7, 8.2.8, 8.2.9, 8.2.10, 8.2.11, 8.2.12, 9.0.0, 9.0.1, 9.0.2, 9.0.3, 9.0.4, 9.0.5, 9.0.6, 9.0.7, 9.0.8, 9.0.9, 9.0.10, 9.1.0, 9.1.1, 9.1.2, 9.1.3, 9.1.4, 9.1.5, 9.1.6, 9.1.7, 9.1.8, 9.1.9, 9.2.0, 9.2.1, 9.2.2, 9.2.3, 9.2.4, 9.2.5, 9.2.6, 9.3.0, 9.3.1, 9.3.2, 9.3.3, 9.3.4, 9.4.0, 9.4.1, 9.4.2


 Download manual
Feedback submitted, thanks!