Format a choropleth SVG
Before you begin to format your SVG visualization, make sure you are familiar with creating and formatting SVG images, as outlined in Generate a choropleth map.
If you want to follow a step by step tutorial to create your own SVG maps and connect them to your Splunk data, see the blog, "Painting with Data: Choropleth SVG" at https://www.splunk.com/en_us/blog/tips-and-tricks/painting-with-data-choropleth-svg.html
Prerequisites
- If you're uploading an SVG locally, in order to format your choropleth SVG, your image structure must have a
pathwith a defineddattribute. Thedattribute determines the shape of the SVG outline using pixel positioning. To read more about this configuration, see https://developer.mozilla.org/en-US/docs/Web/SVG/Tutorial/Paths.
You can also view an SVG's markup structure here: https://jakearchibald.github.io/svgomg/
Connect your SVG with a Splunk dashboard
Follow the steps in the following procedure to connect the path id attributes to your SPL query.
If you would like to use the campus SVG map, you can download, unzip, and add this campus.svg image to your dashboard: Campus.zip.
Steps
- Define a
pathwith adattribute.
For each section you want to define on your map, you must define apathwith adattribute. For example, if your SVG image is of a school campus, and there are 10 buildings, you must define apathwith thedattribute for each building: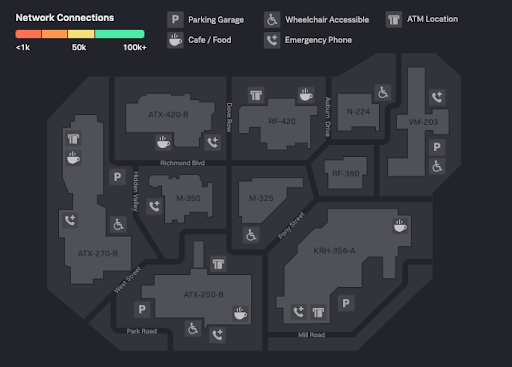
- Assign each path a unique ID.
The Splunk Dashboard Studio can only recognize the boundaries set by thedattribute if itspathhas a unique ID associated with it. For example, in the image, the upper-middle building is called "RF-420", so you can use this as the building's unique ID to easily identify it. This path in your SVG will look similar to the following:
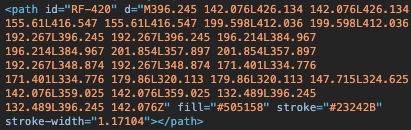
If you want to view or change thepathIDs for your SVG, or if someone else designed the image, you can use a text editor to access and edit this information. - Match your path IDs to the first column of results returned by your search.
There are many ways to do this. You can rename each field in the search using theevalcommand, you can create a lookup file to match the fields with the unique path IDs, or you can change the path IDs of your SVG image file to match the fields returned by your search. To see an example of how a lookup can be used to map path IDs to values, see the example at the end of this topic. - Ensure there is at least one column of numbers associated with each field in your search results.
It is these number values that you will use to determine the fill color of each section. For example, if you run a search to measure network connection traffic (TCP/IP connections per hour) in each building on the school campus, your search would return a table similar to the following (this is not real data):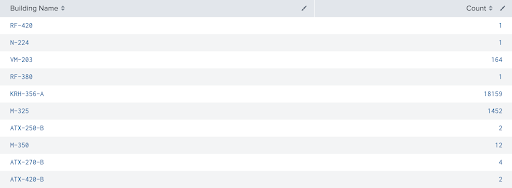


Often, an SVG map will have extra meta-data that makes it very difficult to modify. You can use a free application like Inkscape to simplify the image data by saving the file type as an Optimized SVG.

Configuration Panel options for choropleth SVG
You can use the Configuration panel to configure the following components.
Title
Give your visualization a title. This is also helpful when searching for individual visualizations in the dashboard definitions. This name is not the same as the automatically assigned unique ID.
Description
Give your visualization a description to explain what the user is viewing.
Data Configurations
Choose an existing ad hoc search or create a new one.
Position & Size
You can use your mouse to change the size or location of the visualization, or the Position & Size section of the Configuration panel for pixel perfect sizing and placement.
SVG Data
Upload an SVG image or enter the URL of a web-based image.
Path ID Field Formatting
- After you've added a data source that returns fields that match the path IDs of the SVG, you can use the SVG Path ID Field to specify which field to use. This should be a string field.
- You can use the Value Field menu to choose a field that returns numbers, to format range colors.

- Click the Coloring menu to choose from a number of default color panels, or to set custom colors. You can also modify the color ranges. You can only add as many as seven ranges in the visual editor, but you can add more in the source editor.

- Select a static background color for the panel by clicking the Static Background color box, or by entering a hex code into the text field next to it.
Drilldown
Click + Add Drilldown to allow a user to click the value of a visualization to link to a an external or internal URL.
Code
Select your visualization or its search to view and edit the source code in real-time.
Source options for choropleth SVG
Choropleth SVG options
The following options are available for editing choropleth SVG visualizations in the source editor:
| Property | Type | Default | Description |
|---|---|---|---|
| areaIds | string | > primary | seriesByType("string") | Specify the dataSource field for identifying each area in the Choropleth SVG tagged with an ID field. |
| areaValues | number | > primary | seriesByType("number") | Specify the dataSource field that indicates the values for the areas. |
| areaColors | string | > areaValues | rangeValue(areaColorsRangeConfig) | Specify the dataSource field for setting the SVG fill attribute of identified areas. |
| backgroundColor | string | > themes.defaultBackgroundColor | Specify, using a hex code, the background color behind the SVG map, title, and description. For example, "#0000FF".
|
| svg | string | N/A | KV store location of the SVG image. |
| Generate a choropleth SVG | The source code stanza of a visualization |
This documentation applies to the following versions of Splunk® Enterprise: 8.2.1, 8.2.2, 8.2.3, 8.2.4, 8.2.5, 8.2.6, 8.2.7, 8.2.8, 8.2.9, 8.2.10, 8.2.11, 8.2.12
Feedback submitted, thanks!