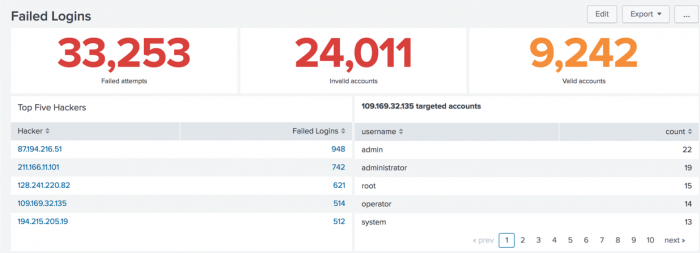
Getting started
Learn how to share insights with data visualizations and dashboards.
There are now two different frameworks you can use for creating visualizations and dashboards. The Classic Splunk dashboards and visualizations framework uses Simple XML as the source code and has a limited user interface. The Splunk Dashboard Studio framework uses JSON-formatted stanzas as the source code for the objects in a dashboard, and for the entire dashboard. The user interface, or visual editor, has many formatting options. For example, you can add visualizations directly to a dashboard and wire them to searches, called data sources, without entering the source editor or using Search & Reporting. To learn more about the Splunk Dashboard Studio, see Splunk Dashboard Studio.
To view a table that compares major feature availability between the two frameworks, see Compare the classic Splunk Dashboards (Simple XML) and the Splunk Dashboard Studio in the Splunk Dashboard Studio manual.
To view a PDF that offers you a short overview of the most common operations, definitions, and commands you will use when you create classic dashboards and visualizations, see the Splunk Dashboards Quick Reference Guide.
The visualization and dashboard workflow
You might need to generate a new visualization or edit an existing dashboard. Working with dashboards and visualizations includes one or more of the following tasks.
Select a visualization
- Select a visualization to show specific data insights.
- To find and compare visualization options, see the Visualization reference.
Generate and configure visualizations
- Write a search to generate a visualization. Make sure that the search returns results in the correct format for rendering the visualization. See Data structure requirements for visualizations for an overview about data formatting.
- Visualizations created in Classic Dashboards and visualizations can be created in Search & Reporting and added to a dashboard or report. Visualizations created using the Splunk Dashboard Studio can also be created in Search & Reporting and added to a pre-existing or new dashboard created in the Dashboard Studio, or can be created within the visual editor of the Dashboard Studio.
- Configure or update visualization appearance and behavior. Change color modes, add captions, or adjust other visualization elements. See the Visualization reference for an overview of classic options and links to details on each visualization type.
Build and edit dashboards
- Add visualizations to new or existing dashboards in the classic Splunk dashboard framework or in Dashboard Studio.
- Work with the editing user interface to adjust dashboard components.
- Convert a dashboard to a form by adding user inputs.
- To get started, see the Dashboard overview and Create dashboards. To get started with Splunk Dashboard Studio see About the Splunk Dashboard Studio editors in the Splunk Dashboard Studio manual.
- Export dashboards for sharing. To get started, see Generate dashboard PDFs.
- Manage permissions for viewing and editing dashboards. See Configure dashboard permissions for details.
- Clone a dashboard or display a dashboard on the app home page. To learn more, see Clone and manage dashboards.
Edit Simple XML
- Use Simple XML source code to customize dashboard content and behavior. See About editing Simple XML for an overview and the Simple XML reference for more details.
| Visualization reference |
This documentation applies to the following versions of Splunk® Enterprise: 8.2.0, 8.2.1, 8.2.2, 8.2.3, 8.2.4, 8.2.5, 8.2.6, 8.2.7, 8.2.8, 8.2.9, 8.2.10, 8.2.11, 8.2.12, 9.0.0, 9.0.1, 9.0.2, 9.0.3, 9.0.4, 9.0.5, 9.0.6, 9.0.7, 9.0.8, 9.0.9, 9.0.10, 9.1.0, 9.1.1, 9.1.2, 9.1.3, 9.1.4, 9.1.5, 9.1.6, 9.2.0, 9.2.1, 9.2.2, 9.2.3, 9.3.0, 9.3.1

 Download manual
Feedback submitted, thanks!