Tutorial overview
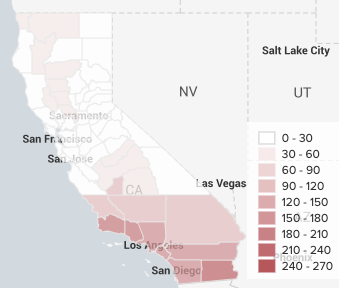
Choropleth maps visualize data aggregated by location.
To create a choropleth map that visualizes a value, you need a geographic feature collection that provides geographic boundaries at the same level of granularity as your data. For example, if you want to map the US population by state, you can use a Splunk search to create a statistics table with a row for the population of each state and use the geo_us_states lookup to render the geometry of states on the map. To map the population by county, you would need to create a more granular table with a row for every US county and a new geospatial lookup that provides boundaries of all US counties. To learn more about geospatial lookups, see Define a geospatial lookup in Splunk Web in the Knowledge Manager Manual.
Goals
In this tutorial, you will learn how to do the following:
- Locate and upload a public data file from the United States Drought Monitor and a geospatial boundary file at the appropriate level of granularity into your Splunk platform instance.
- Use the lookup file to create a new geospatial lookup in addition to the
geo_us_statesandgeo_countrieslookups that are included with Splunk software. - Generate a choropleth map that demonstrates the severity of drought conditions by California county in 2018.
Your finished choropleth map will look like the following image:

Prerequisite
Make sure that you have a running Splunk platform instance. See the following links for information:
Steps
| Cluster maps | Locate and download USDM data |
This documentation applies to the following versions of Splunk® Enterprise: 7.0.0, 7.0.1, 7.0.2, 7.0.3, 7.0.4, 7.0.5, 7.0.6, 7.0.7, 7.0.8, 7.0.9, 7.0.10, 7.0.11, 7.0.13, 7.1.0, 7.1.1, 7.1.2, 7.1.3, 7.1.4, 7.1.5, 7.1.6, 7.1.7, 7.1.8, 7.1.9, 7.1.10, 7.2.0, 7.2.1, 7.2.2, 7.2.3, 7.2.4, 7.2.5, 7.2.6, 7.2.7, 7.2.8, 7.2.9, 7.2.10, 7.3.0, 7.3.1, 7.3.2, 7.3.3, 7.3.4, 7.3.5, 7.3.6, 7.3.7, 7.3.8, 7.3.9, 8.0.0, 8.0.1, 8.0.2, 8.0.3, 8.0.4, 8.0.5, 8.0.6, 8.0.7, 8.0.8, 8.0.9, 8.0.10, 8.1.0, 8.1.1, 8.1.2, 8.1.3, 8.1.4, 8.1.5, 8.1.6, 8.1.7, 8.1.8, 8.1.9, 8.1.10, 8.1.11, 8.1.12, 8.1.13, 8.1.14, 8.2.0, 8.2.1, 8.2.2, 8.2.3, 8.2.4, 8.2.5, 8.2.6, 8.2.7, 8.2.8, 8.2.9, 8.2.10, 8.2.11, 8.2.12, 9.0.0, 9.0.1, 9.0.2, 9.0.3, 9.0.4, 9.0.5, 9.0.6, 9.0.7, 9.0.8, 9.0.9, 9.0.10, 9.1.0, 9.1.1, 9.1.2, 9.1.3, 9.1.4, 9.1.5, 9.1.6, 9.1.7, 9.1.8, 9.1.9, 9.2.0, 9.2.1, 9.2.2, 9.2.3, 9.2.4, 9.2.5, 9.2.6, 9.3.0, 9.3.1, 9.3.2, 9.3.3, 9.3.4, 9.4.0, 9.4.1, 9.4.2
 Download manual
Feedback submitted, thanks!