Cluster maps
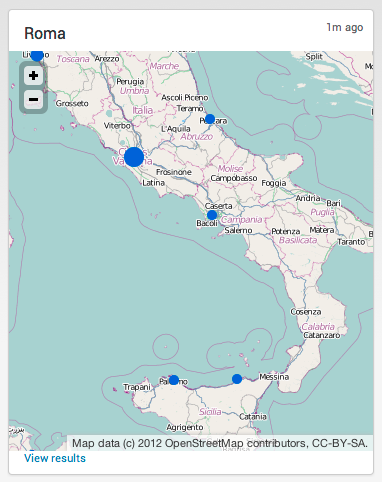
Use the cluster map visualization to plot aggregated values on a map.
Data formatting
To generate a cluster map, use the geostats command. The geostats command generates events that include latitude and longitude coordinates for markers. It is similar to the stats command, but provides options for zoom levels and cells for mapping.
For more information, see geostats in the Search Reference.
Configuration options
Use the Format menu to adjust the following cluster map components.
- Tile appearance and source
- Cluster marker appearance
- Zoom on scroll behavior
Example
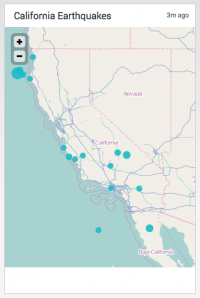
The following search generates a map showing California earthquakes of magnitude greater than 3 for the past 30 days.
index=main mag>3 | geostats latfield=latitude longfield=longitude count
When a user clicks on a cluster indicating earthquake data, a search launches using the latitude and longitude boundaries of that cluster.
index=main mag>3 | search latitude>=36.21094 latitude<36.56250 longitude>=-122.34375 longitude<-121.64062
| Use IP addresses to generate a choropleth map | Tutorial overview |
This documentation applies to the following versions of Splunk® Enterprise: 7.0.0, 7.0.1, 7.0.2, 7.0.3, 7.0.4, 7.0.5, 7.0.6, 7.0.7, 7.0.8, 7.0.9, 7.0.10, 7.0.11, 7.0.13, 7.1.0, 7.1.1, 7.1.2, 7.1.3, 7.1.4, 7.1.5, 7.1.6, 7.1.7, 7.1.8, 7.1.9, 7.1.10, 7.2.0, 7.2.1, 7.2.2, 7.2.3, 7.2.4, 7.2.5, 7.2.6, 7.2.7, 7.2.8, 7.2.9, 7.2.10, 7.3.0, 7.3.1, 7.3.2, 7.3.3, 7.3.4, 7.3.5, 7.3.6, 7.3.7, 7.3.8, 7.3.9, 8.0.0, 8.0.1, 8.0.2, 8.0.3, 8.0.4, 8.0.5, 8.0.6, 8.0.7, 8.0.8, 8.0.9, 8.0.10, 8.1.0, 8.1.1, 8.1.2, 8.1.3, 8.1.4, 8.1.5, 8.1.6, 8.1.7, 8.1.8, 8.1.9, 8.1.10, 8.1.11, 8.1.12, 8.1.13, 8.1.14, 8.2.0, 8.2.1, 8.2.2, 8.2.3, 8.2.4, 8.2.5, 8.2.6, 8.2.7, 8.2.8, 8.2.9, 8.2.10, 8.2.11, 8.2.12, 9.0.0, 9.0.1, 9.0.2, 9.0.3, 9.0.4, 9.0.5, 9.0.6, 9.0.7, 9.0.8, 9.0.9, 9.0.10, 9.1.0, 9.1.1, 9.1.2, 9.1.3, 9.1.4, 9.1.5, 9.1.6, 9.1.7, 9.1.8, 9.1.9, 9.2.0, 9.2.1, 9.2.2, 9.2.3, 9.2.4, 9.2.5, 9.2.6, 9.3.0, 9.3.1, 9.3.2, 9.3.3, 9.3.4, 9.4.0, 9.4.1, 9.4.2


 Download manual
Feedback submitted, thanks!