Types of data in the Analytics Workspace
The Analytics Workspace Data panel contains the data sources that you have available for visualization and analysis. These data sources are organized by data type. Supported data types are metrics, datasets, and alerts.
About metrics data
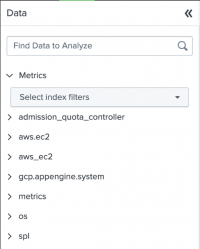
Click the Metrics tab in the Data panel to view a list of metrics. Metrics data sources are listed in a tree structure or index according to their metric_name.
For example, the following image shows a default view of the Metrics data source index list.
If two metrics with the same name are ingested into different indexes, they appear aggregated in the Data panel. To distinguish these metrics in the workspace, see Distinguish metrics with the same metric name.
The Analytics Workspace does not currently support metric roll-ups.
To learn more about metrics data, including metrics ingest, see Overview of Metrics in the Metrics Manual.
For information about converting log data into metrics data, see Convert event logs to metric data points in the Metrics Manual.
About datasets
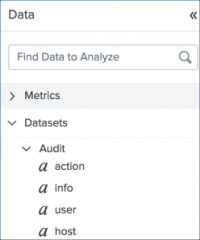
Click the Datasets tab in the Data panel to view a list of datasets. Datasets are listed in a tree structure according to the dataset name. Click a dataset name to see a list of fields for the dataset. Numeric fields are indicated by the hash (![]() ) icon, whereas string fields are indicated by the alpha (
) icon, whereas string fields are indicated by the alpha (![]() ) icon.
) icon.
For example, the following image shows a list of fields for the Audit dataset.
Only accelerated datasets are supported in the Analytics Workspace. See Accelerate data models in the Knowledge Manager Manual for more information.
For more information about datasets, see Dataset types and usage in the Knowledge Manager Manual.
About alerts
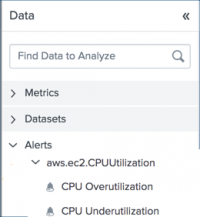
Click the Alerts tab in the Data panel to view a list of alerts that were created in the Analytics Workspace. The Alerts tab includes alerts that you created and alerts that have been shared with you. Alerts are listed in a tree structure according to the data source they use. Click a data source name to see a list of alerts that are based on it.
For example, the following image shows a list of Analytics Workspace alerts for the aws.ec2.CPUUtilization metric.
For more information about Analytics Workspace alerts, see Alerts in the Analytics Workspace.
| Navigating the Analytics Workspace | Charts in the Analytics Workspace |
This documentation applies to the following versions of Splunk® Enterprise: 8.1.0, 8.2.0, 8.2.1, 8.2.2, 8.2.3, 8.2.4, 8.2.5, 8.2.6, 8.2.7, 8.2.8, 8.2.9, 8.2.10, 8.2.11, 8.2.12, 9.0.0, 9.0.1, 9.0.2, 9.0.3, 9.0.4, 9.0.5, 9.0.6, 9.0.7, 9.0.8, 9.0.9, 9.0.10, 9.1.0, 9.1.1, 9.1.2, 9.1.3, 9.1.4, 9.1.5, 9.1.6, 9.1.7, 9.1.8, 9.1.9, 9.2.0, 9.2.1, 9.2.2, 9.2.3, 9.2.4, 9.2.5, 9.2.6, 9.3.0, 9.3.1, 9.3.2, 9.3.3, 9.3.4, 9.4.0, 9.4.1, 9.4.2


 Download manual
Feedback submitted, thanks!