Dynamic options syntax formatting functions
Dynamic options syntax (DOS) is the programming syntax used in Dashboard Studio for visualization options and dynamic menu options for inputs. You can use formatting functions in DOS to transform and map the data into a desired format. See Dynamic options in Dashboard Studio to learn more about dynamic options.
Dynamic options syntax structure
Dynamic Options Syntax (DOS) structure has several parts, each separated by a pipe ( | ).
| DOS Part | What it does | Required? |
|---|---|---|
| Data Source | An originating data source, which can be a visualization data source such as a primary data source or visualization options such as sparklineValues. The location of your data sources, searches, and options for each search you create in the visual editor. | Yes |
| Selector functions | Identifies the data from the data source associated with the visualization. A dynamic option can have one or multiple selector functions. | No |
| Formatting function | Formats the selected data. | Optional unless additional data formatting is needed. |
A typical DOS structure looks like the following:
Option: "> [data source] | [selector functions] | [formatting function]"
Formatting functions
You can use formatting functions to configure your selected data.
formatByType()
Select Expand to see a description, an example, and an example result for the formatting function formatByType():
Description
You can use the formatByType() function to compose a value based on the provided configuration and that value's type, such as a number or string.
Example code syntax
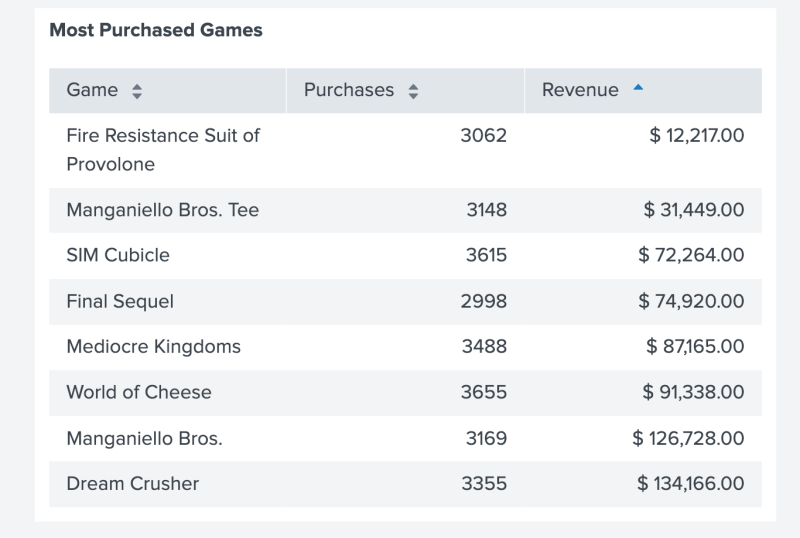
The following code example uses formatByType() to add a $ symbol to the beginning of all values in the Revenue column. Additionally, formatByType() applies a precision of 2 to each number value, determining the number of digits displayed after a decimal point.
{
   "type": "splunk.table",
   "dataSources": {
       "primary": "ds_most_purchased_games_1"
   },
   "title": "Most Purchased Games",
   "options": {
       "columnFormat": {
           "Revenue": {
               "data": "> table | seriesByName(\"Revenue\") | formatByType(RevenueColumnFormatEditorConfig)"
           }
       }
   },
   "context": {
       "RevenueColumnFormatEditorConfig": {
           "number": {
               "thousandSeparated": true,
               "unitPosition": "before",
               "unit": "$",
               "precision": 2
           }
       }
   }
}
Example result
The following table shows the result of using formatByType() to add a $ symbol to all values in the Revenue column.
frame()
Select Expand to see a description, an example, and an example result for the formatting function frame():
Description
The frame() function can combine arguments into a new DataFrame. For more details about DataFrame, DataSeries, and DataPoint selectors, see Dynamic options syntax selector functions.
Example code syntax
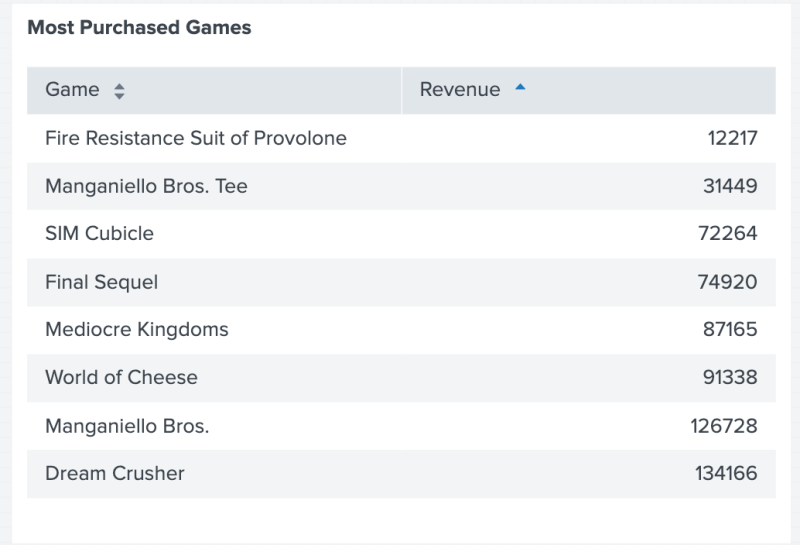
The following code example uses frame() to combine the data in the Game and Revenue columns and use the result as a data source for the table.
{
   "type": "splunk.table",
   "dataSources": {
       "primary": "ds_most_purchased_games_1"
   },
   "title": "Most Purchased Games",
   "options": {
       "table" : "> frame(Game, Revenue)"
   },
   "context": {
       "Game": "> primary | seriesByName(\"Game\")",
       "Revenue": "> primary | seriesByName(\"Revenue\")"
   }
}
Example result
The following table shows the result of using frame() to combine the data in the Game and Revenue columns and use the result as a data source for the table.
gradient()
Select Expand to see a description, an example, and an example result for the formatting function gradient():
Description
You can use the gradient() function to map values to a color. Define your values as stops and your colors as colors. If no config is specified, the default colors are ['rgba(123,86,219,0.4)', 'rgba(123,86,219,1)']. The default stops are dependent on the DataSeries provided.
If a DataSeries has n values, you can configure the stops between a minimum and maximum. The minimum and maximum map to rgba(123,86,219,0.4) and rgba(123,86,219,1), respectively.
For more details about DataFrame, DataSeries, and DataPoint selectors, see Dynamic options syntax selector functions.
Example code syntax
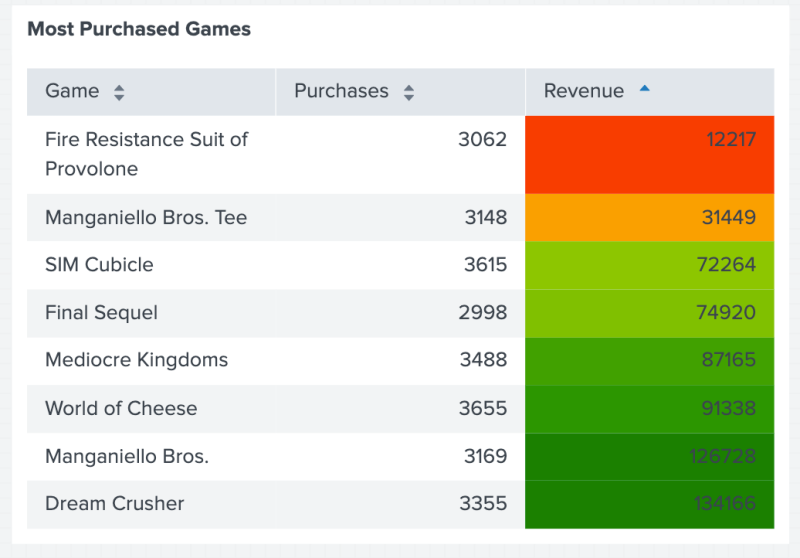
The following code example uses gradient() to create a color gradient scheme for a column with number values.
{
  "type": "splunk.table",
     "dataSources": {
         "primary": "ds_most_purchased_games_1"
   },
   "title": "Most Purchased Games",
   "options": {
       "columnFormat": {
           "Revenue": {
               "rowBackgroundColors": "> table | seriesByName(\"Revenue\") | gradient(gradientConfig)"
           }
       }
   },
   "context": {
       "gradientConfig":{
           "stops": [
               0,
               50000,
               100000
           ],
            "colors": [
               "red",
               "yellow",
               "green"
           ]
       }
   }
}
Example result
The following table shows the result of using gradient() to color the profits in the Revenue column, ranging from the lowest revenue in red to the highest revenue in dark green.
matchValue()
Select Expand to see a description, an example, and an example result for the formatting function matchValue():
Description
You can use the matchValue() function to map potential matches to corresponding default values. For example, you can match the number 234 to the color green. Each time 234 appears on a table, its font is green.
Example code syntax
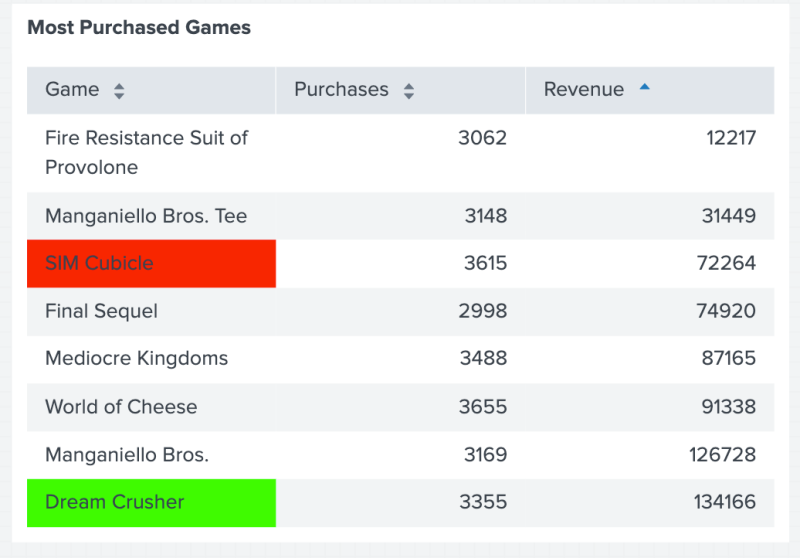
The following code example uses matchValue() to add color to values depending on whether the value matches true, false, or some other known value.
{
   "type": "splunk.table",
   "dataSources": {
       "primary": "ds_most_purchased_games_1"
   },
   "title": "Most Purchased Games",
   "options": {
       "columnFormat": {
           "Game": {
               "rowBackgroundColors": "> table | seriesByName(\"Game\") | matchValue(matchConfig)"
           }
       }
   },
   "context": {
       "matchConfig": [
         {
               "match": "SIM Cubicle",
               "value": "#FF0000"
           },
           {
               "match": "Dream Crusher",
               "value": "#00FF00"
           }
       ]
   }
}
Example result
The following table shows the result of using matchValue() to add color to SIM Cubicle and Dream Crusher.
multiFormat()
Select Expand to see a description, an example, and an example result for the formatting function multiFormat():
Description
You can use the multiFormat() function to format multiple fields. The formatting function accepts a config object containing a map of field specific formatters which is used to evaluate each fields' corresponding values. The following three fields are required:
nameFielddesignates the list of keys with custom formatters to be applied againstvalueFielddesignates the field to derive the values fromformatter1is an object that requires the configuration required for the specified formatter and the name of the formatter, such as "rangeValue" or "matchValue"
Example code syntax
The following code example uses multiFormat() to format multiple columns depending on the column's name.
{
    "type": "splunk.choropleth.svg",
    "options": {
        "svg": "https://splunkudftest.s3-us-west-1.amazonaws.com/campus.svg",
        "areaIds": "> primary | seriesByIndex(0)",
        "areaValues": "> primary | seriesByIndex(1)",
        "areaColors": "> primary | multiFormat(areaColorsConfig)"
    },
    "dataSources": {
        "primary": {
            "requestParams": {
                "offset": 0,
                "count": 20
            },
            "data": {
                "fields": [
                    {
                        "name": "buildings"
                    },
                    {
                        "name": "values"
                    }
                ],
                "columns": [
                    [
                        "ATX-270-B",
                        "N-224",
                        "VM-203",
                        "RF-380"
                    ],
                    [
                        "10000",
                        "55000",
                        "90000",
                        "75000"
                    ]
                ]
            },
            "meta": {
                "totalCount": 100
            }
        }
    },
    "context": {
        "areaColorsConfig": {
            "nameField": "buildings",
            "valueField": "values",
            "formatters": {
                "ATX-270-B": {
                    "type": "matchValue",
                    "config": [
                        {
                            "match": 10000,
                            "value": "#00FF00"
                        },
                        {
                            "match": 20000,
                            "value": "#FF0000"
                        }
                    ]
                },
                "N-224": {
                    "type": "gradient",
                    "config": {
                        "colors": [
                            "#FF7152",
                            "#FFEBA8"
                        ]
                    }
                },
                "VM-203": {
                    "type": "rangeValue",
                    "config": [
                        {
                            "from": 80000,
                            "value": "#4B4BFF"
                        },
                        {
                            "to": 20000,
                            "value": "#FF0000"
                        }
                    ]
                },
                "RF-380": {
                    "type": "rangeValue",
                    "config": [
                        {
                            "from": 80000,
                            "value": "#4BEBA8"
                        },
                        {
                            "from": 60000,
                            "to": 80000,
                            "value": "#F4DF7A"
                        },
                        {
                            "from": 20000,
                            "to": 60000,
                            "value": "#FC9850"
                        },
                        {
                            "to": 20000,
                            "value": "#FF0000"
                        }
                    ]
                }
            }
        }
    }
}
Example result
The following image shows the result of using multiFormat() to color different buildings within a map based on the number of network connections in that building.
objects()
Select Expand to see a description, an example, and an example result for the formatting function objects():
Description
You can use the objects() function to convert a DataPrimitive into an array of objects. A DataPrimitive is either a DataFrame, DataSeries, or DataPoint. For more details about DataFrame, DataSeries, and DataPoint selectors, see Dynamic options syntax selector functions.
Example code syntax
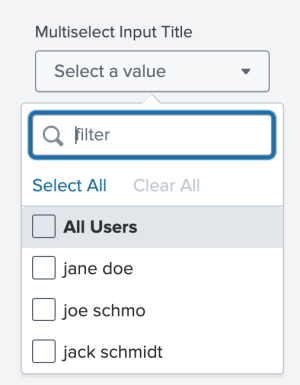
The following code example uses objects() to define custom static options.
{
   "context": {
       "staticOptions": [
           [
               "All Users"
           ],
           [
               "*"
           ]
       ],
       "field1": "> primary | seriesByName(\"users\") | renameSeries(\"label\")",
       "field2": "> primary | seriesByName(\"ids\") | renameSeries(\"value\")"
   },
   "options": {
       "items": "> frame(field1, field2) | prepend(staticOptions) | objects()"
   },
   "dataSources": {
       "primary": "ds_search1"
   },
   "title": "Multiselect Input Title",
   "type": "input.multiselect"
}
Example result
The following image shows the result of using objects() to populate a multiselect input with the names of users.
pick()
Select Expand to see a description, an example, and an example result for the formatting function pick():
Description
You can pass a map or array config through the pick() function.
If a map is provided, it will use the DataPoint's field name to pick the corresponding entry in the config.
For example, if the config contains 2 elements and the DataSeries includes 10 elements, pick() loops through the config 5 times, alternating between which element is appended to the output. For more details about DataFrame, DataSeries, and DataPoint selectors, see Dynamic options syntax selector functions.
Example code syntax for providing an array
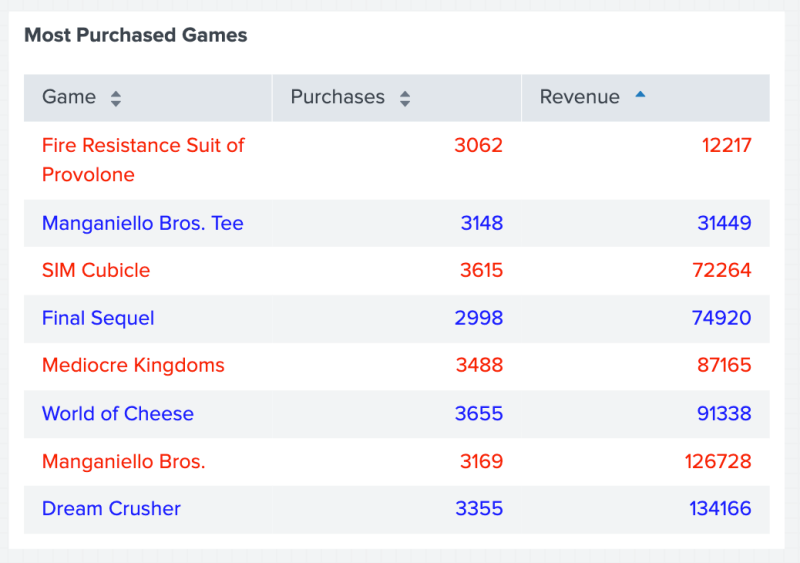
The following code example uses pick() to color odd rows with red text and even rows with blue text.
{
   "type": "splunk.table",
   "dataSources": {
       "primary": "ds_most_purchased_games_1"
   },
   "title": "Most Purchased Games",
   "options": {
       "tableFormat": {
           "rowColors": "> table | pick(rowTextColor)"
       }
   },
   "context": {
       "rowTextColor": ["#FF0000", "#0000FF"]
   }
}
Example result for providing an array
The following table shows the result of using pick() to rotate between the colors red and blue and apply color for each row of the table.
Example code syntax for providing a map
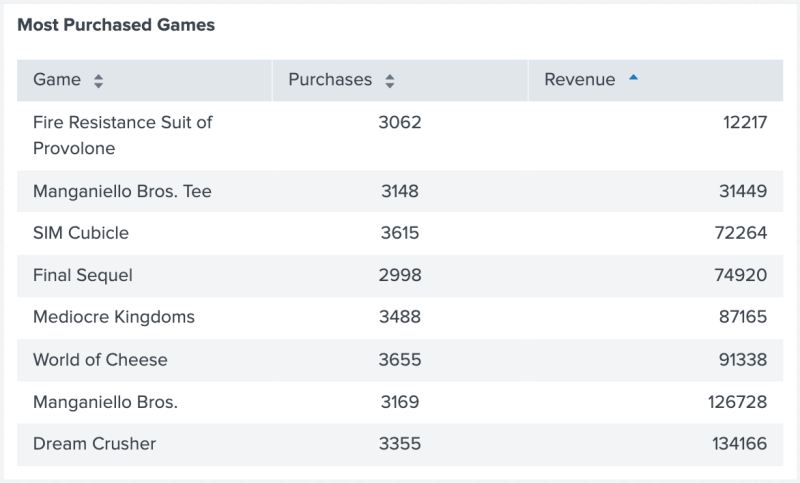
The following code example uses pick() to align the columns "Game", "Purchases" and "Revenue" to "left", "center" and "right" using a map config.
{
   "type": "splunk.table",
   "dataSources": {
       "primary": "ds_most_purchased_games_1"
   },
   "title": "Most Purchased Games",
   "options": {
       "tableFormat": {
           "align": "> table | pick(mapConfig)"
       }
   },
   "context": {
       "mapConfig": {
           "Game": "left",
           "Purchases": "center",
           "Revenue": "right"
       }
   }
}
Example result for providing a map
The following table shows the result of using pick() to align the values of the columns "Game", "Purchases", and "Revenue" to "left", "center", and "right".
prefix()
Select Expand to see a description, an example, and an example result for the formatting function prefix():
Description
You can use the prefix() function to add a given prefix to the beginning of the DataPoint. For example, you can return the string "bar100" if the number 100 is your DataPoint, and you pass "bar" as a parameter to prefix(). For more details about DataFrame, DataSeries, and DataPoint selectors, see Dynamic options syntax selector functions.
Example code syntax
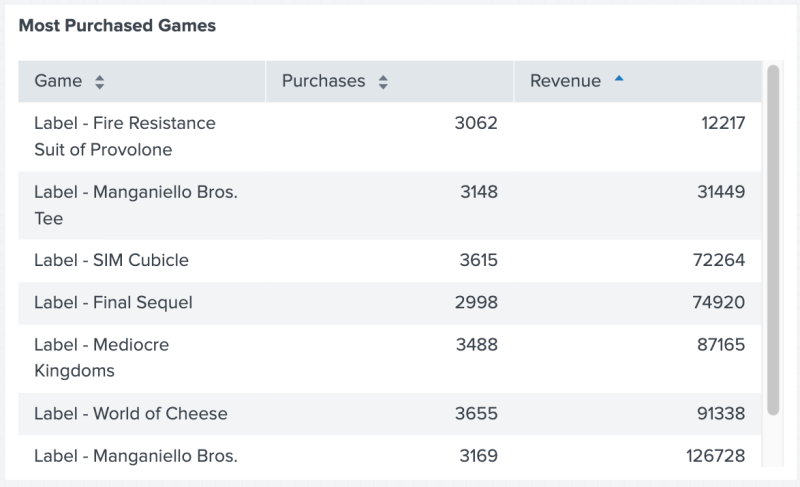
The following code example uses prefix() to add the text "Label -" to the beginning of all data values in column "Game".
{
    "type": "splunk.table",
    "dataSources": {
        "primary": "ds_most_purchased_games_1"
    },
    "title": "Most Purchased Games",
    "options": {
        "columnFormat": {
            "Game": {
                "data": "> table | seriesByName(\"Game\") | prefix(\"Label - \")"
            }
        }
    }
}
Example result
The following image shows the result of using the prefix() function to add "Label -" to the beginning of each value in the Game column.
prepend()
Select Expand to see a description, an example, and an example result for the formatting function prepend():
Description
You can use the prepend() function to add a DataFrame, DataSeries, or DataPoint to the beginning of an existing DataFrame or DataSeries with compatible types.
If prepending a DataFrame to another DataFrame, the DataFrames must have the same number of DataSeries. For example, a DataFrame with 3 series, such as [[1, 2], [3, 4], [5, 6]], cannot be prepended to a DataFrame with 2 series, such as [[7, 8], [9, 10]].
A DataPrimitive is either a DataFrame, DataSeries, or DataPoint. Only the same DataPrimitive type or a DataPrimitive's composite DataPrimitives can be prepended to the pre-existing DataPrimitive. A composite DataPrimitive is any DataPrimitive that makes another, such as multiple DataPoints making a DataSeries, or multiple DataSeries making a DataFrame.
For more details about DataFrame, DataSeries, and DataPoint selectors, see Dynamic options syntax selector functions.
Example code syntax
The following code example uses prepend() to add a dataFrame named "prependGames" to the "primary" dataFrame.
{
   "type": "splunk.table",
   "dataSources": {
       "primary": "ds_most_purchased_games_1"
   },
   "title": "Most Purchased Games",
   "options": {
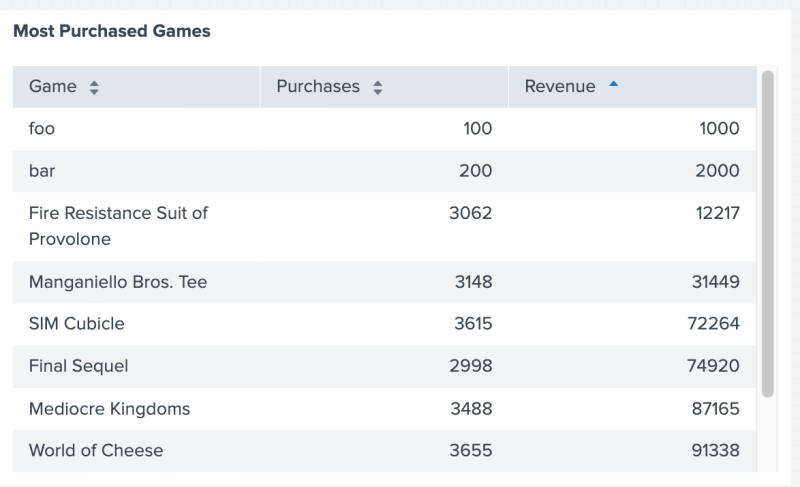
       "table" : "> primary | prepend(prependGames)"
   },
   "context": {
       "prependGames" : [["foo", "bar"], [100, 200], [1000, 2000]]
   }
}
Example result
The following image shows the result of using prepend() to add the games "foo" and "bar" to the top of the table.
rangeValue()
Select Expand to see a description, an example, and an example result for the formatting function rangeValue():
Description
You can use the rangeValue()) function to return a specific value from a range of different values. The rangeValue() function takes a list of ranges and a default value. If no range is available, the function returns the default value. If neither range or default value is present, the function returns the original value. For example, you can have a range of colors that correlate to different numbers. You can then use rangeValue() to take a separate value, find that value within the range of colors, and return the correlating color of that value.
A fitting describes how an input data value is mapped to a given set of ranges to derive the formatter function output. The range fitting follows this criteria: range.from is less than or equal to value which is less than range.to.
The following are different ways you can define a range:
- Closed bound range
{ "value": "#CBA700", "from": 50000, "to": 100000 } - Open lower bound range
{ "value": "#D41F1F", "to": 25000 } - Open upper bound range
{
  "value": "#118832",
  "from": 100000
}
Example code syntax
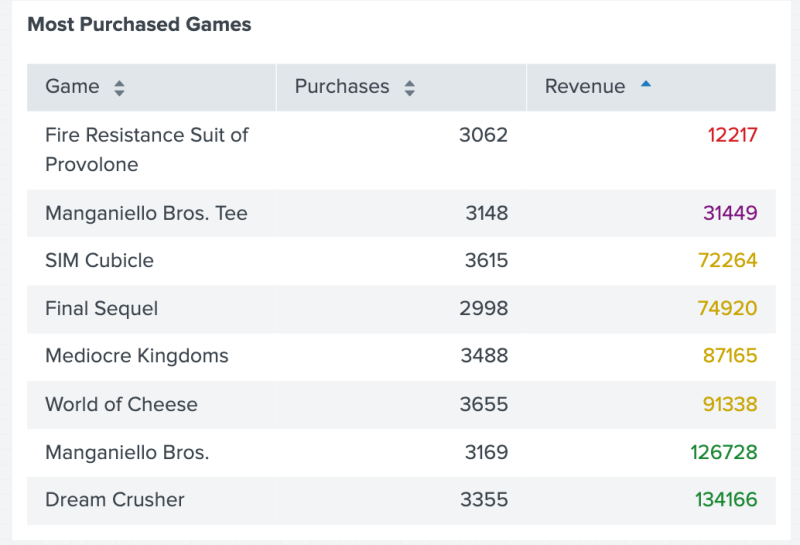
The following code example uses rangeValue() to apply a color range to numerical values in a column.
{
   "type": "splunk.table",
   "dataSources": {
       "primary": "ds_most_purchased_games_1"
   },
   "title": "Most Purchased Games",
   "options": {
       "columnFormat": {
           "Revenue": {
               "rowColors": "> table | seriesByName(\"Revenue\") | rangeValue(RevenueRowColorsEditorConfig, \"purple\")"
           }
       }
   },
   "context": {
       "RevenueRowColorsEditorConfig": [
           {
               "value": "#D41F1F",
               "to": 25000
           },
           {
               "value": "#CBA700",
               "from": 50000,
               "to": 100000
           },
           {
               "value": "#118832",
               "from": 100000
           }
       ]
   }
  }
Example result
The following image shows the result of using rangeValue() to apply a color range to the values in the Revenue column.
type()
Select Expand to see a description, an example, and an example result for the formatting function type():
Description
You can use the type() function to return the data type for each element within a given DataSeries. For more details about DataFrame, DataSeries, and DataPoint selectors, see Dynamic options syntax selector functions.
Example code syntax
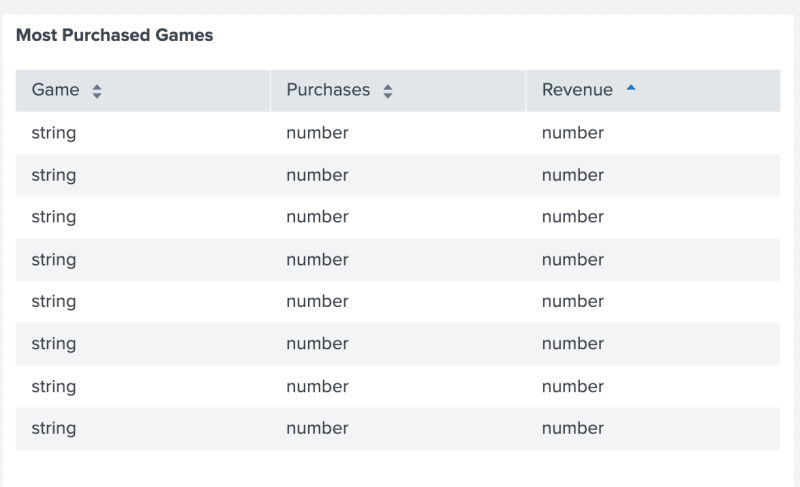
The following code example uses type() to display the type of each data point in the table.
{
   "type": "splunk.table",
   "dataSources": {
       "primary": "ds_most_purchased_games_1"
   },
   "title": "Most Purchased Games",
   "options": {
       "table": "> primary | type()"
   }
 }
Example result
The following image shows the result of using type() to display the type of each data point in each column.
maxContrast()
Select Expand to see a description, an example, and an example result for the formatting function maxContrast():
Description
You can use the maxContrast() function to pick the color assigned with the maximum contrast. maxContrast() leverages Chromajs.contrast to determine the contrast between color and values. For details, see "Chroma.js" on the GitHub pages website.
Example code syntax
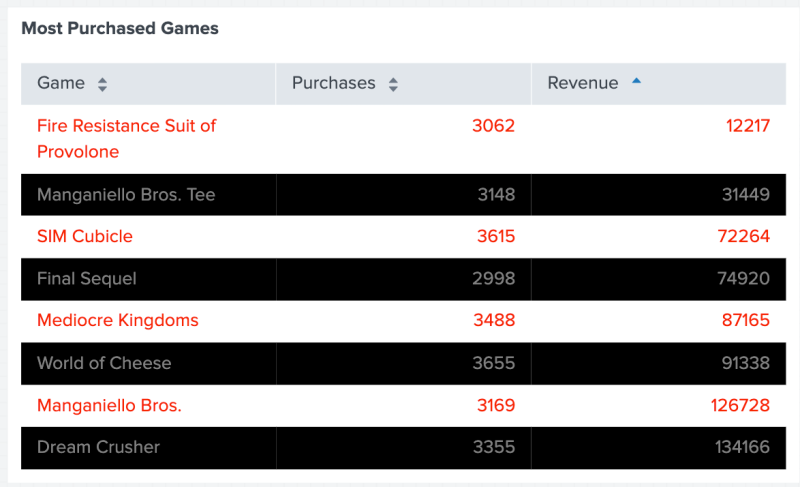
The following code example uses maxContrast() to color each row's text with a contrast color based on the background's color. For example, if the background is white, the text color is red. If the background is black, then the text color is gray.
{
   "type": "splunk.table",
   "dataSources": {
       "primary": "ds_most_purchased_games_1"
   },
   "title": "Most Purchased Games",
   "options": {
       "tableFormat" : {
           "rowColors" : "> primary | pick(rowTextColors) | maxContrast(contrastConfig)"
       }
   },
   "context": {
       "contrastConfig" : {
           "colors" : ["red", "gray"]
       },
       "rowTextColors": ["white", "black"]


   }
}
Example result
The following image shows the result of using maxContrast() to color each row's text to contrast against the row's background color.
setColorChannel()
Select Expand to see a description, an example, and an example result for the formatting function setColorChannel():
Description
You can use the setColorChannel() function to modify a given color's chromaticity. Chromaticity is a property that characterizes the quality of a color. setColorChannel() leverages Chromajs.contrast to determine the contrast between color and values. For details, see "Chroma.js" on the GitHub pages website.
Example code syntax
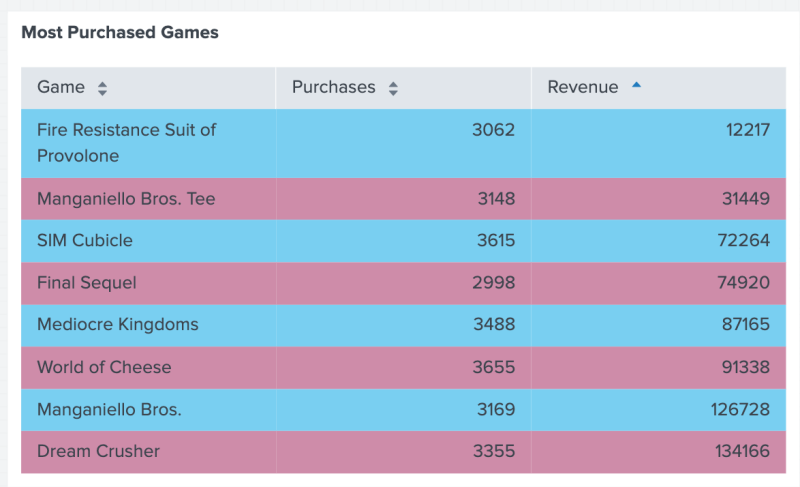
The following code example uses setColorChannel() to set chromaticity to 30 for the colors "skyblue" and "hotpink".
{
   "type": "splunk.table",
   "dataSources": {
       "primary": "ds_most_purchased_games_1"
   },
   "title": "Most Purchased Games",
   "options": {
       "tableFormat": {
           "rowBackgroundColors": "> primary | pick(rowColors) | setColorChannel(rowBGConfig)"
       }
   },
   "context": {
       "rowBGConfig": {
            "channel": "lch.c",
            "value": "30"
        },
        "rowColors" : ["skyblue", "hotpink"]
   }
}
Example result
The following image shows the result of using setColorChannel() to set the chromaticity of the table's "skyblue" and "hotpink" colored rows. A chromaticity of 30 slightly mutes the colors "skyblue" and "hotpink".
| Dynamic options syntax selector functions | Default configuration options |
This documentation applies to the following versions of Splunk® Enterprise: 9.1.0, 9.1.1, 9.1.2, 9.1.3, 9.1.4, 9.1.5, 9.1.6, 9.1.7, 9.1.8, 9.1.9, 9.2.0, 9.2.1, 9.2.2, 9.2.3, 9.2.4, 9.2.5, 9.2.6, 9.3.0, 9.3.1, 9.3.2, 9.3.3, 9.3.4, 9.4.0, 9.4.1, 9.4.2

 Download manual
Feedback submitted, thanks!