Scenario: Skyler conditionally shows and hides dashboard panels
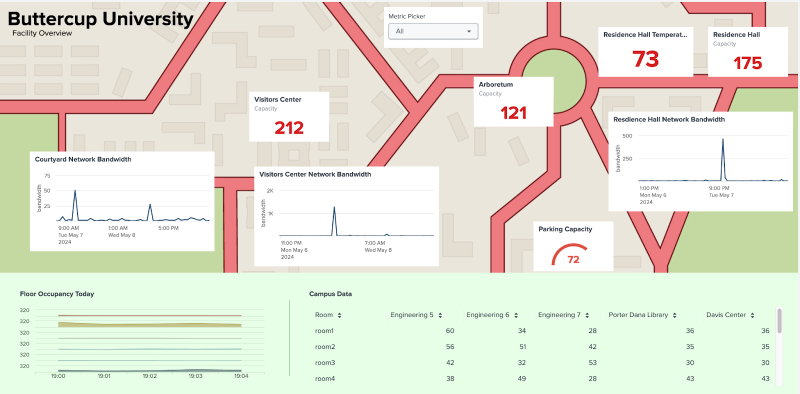
Skyler is a campus administrator at Buttercup University. They oversee facilities management for the whole campus, including occupancy, network bandwidth, and environmental temperatures of different buildings. Skyler wants to build a dashboard to help them monitor campus facilities during Parents' Weekend, a weekend when Buttercup University invites students' parents to visit the school and tour the campus. A dashboard that dynamically updates with new data and organizes based on data availability helps Skyler focus on critical variables to coordinate crowd control and catch any potential network outages due to high traffic volume.
Buttercup University uses Dashboard Studio, which offers a range of customization tools for Splunk dashboards, empowering users to design layouts, choose colors, and incorporate images. With Dashboard Studio, Skyler knows they can do the following to make their dashboard more dynamic:
- Conditionally show or hide dashboard panels based on data availability
- Configure the Splunk Search Processing Language (SPL) to make panels dependent on tokens
Conditionally show or hide dashboard panels
To configure dashboard panels to show only when data is available, Skyler takes the following steps:
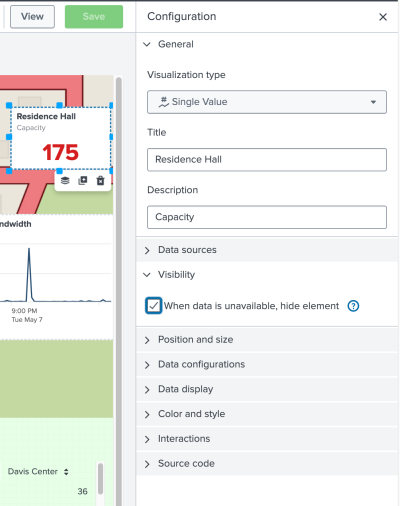
- They select their visualization or input. For example, the residence hall visualization.
- They navigate to the Configuration panel and find the Visibility section.
- Skyler selects the checkbox to hide the element when data isn't available.
When Skyler reviews the dashboard, there's a confirmation dotted blue line that surrounds the visualization they are about to hide. In this case, it's for the Residence Hall.
Configure SPL to make panels dependent on tokens
To achieve a more responsive layout, Skyler applies a similar show or hide logic to an SPL search that they can use throughout their dashboard. They write the following SPL search that returns results if the $metric$ token resolves to "Occupancy" or "*":
index = occupancy
...
| head limit=100 ($metric|s$ = "Occupancy" OR $metric|s$ = "*" )
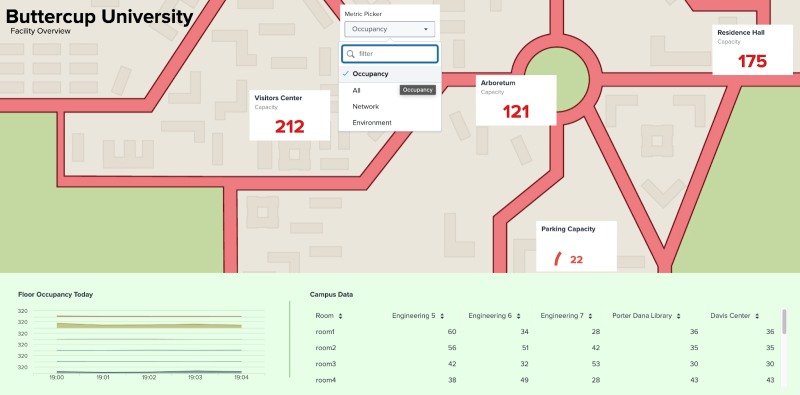
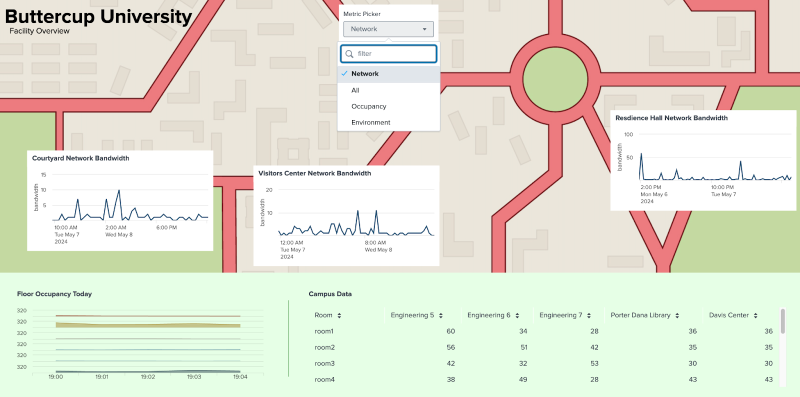
With the SPL search applied to all of the relevant visualizations, Skyler can selectively view different metrics of Buttercup University by picking an option in a drop-down list.
In this first dashboard, Skyler filters by occupancy of the main buildings on campus:
Next, Skyler filters Buttercup University by network bandwidth in various buildings:
Summary
Skyler used Dashboard Studio to create a dynamic dashboard that helps them monitor campus facilities by factors like occupancy, environment, and network. They implemented the show or hide option in the Configuration panel and wrote an SPL search that uses tokens to display different metrics depending on a selected drop-down option. Their close observation of the dashboard helped them notice when the residence hall nearly reached capacity and jeopardized network bandwidth in the area. Luckily, Skyler coordinated with facility management to quickly reroute a few campus tours, and Parents' Weekend was a success!
Learn more
- Learn more about showing or hiding panels in Conditionally show or hide panels.
- To embed search related information in visualizations, see Setting tokens from search results or search job metadata.
| Conditionally show or hide panels | Set global and local defaults |
This documentation applies to the following versions of Splunk® Enterprise: 9.3.0, 9.3.1, 9.3.2, 9.3.3, 9.3.4, 9.4.0, 9.4.1, 9.4.2


 Download manual
Feedback submitted, thanks!