Identify event patterns with the Patterns tab
Events in search results can be grouped into event patterns. Events that belong to an event pattern share common characteristics, and usually can be returned by a specific search string. Event pattern analysis is useful for searches that return a diverse range of events because it quickly shows you the most common kinds of events in your search result dataset.
The Patterns tab simplifies event pattern identification. Click the Pattern tab to view a list of the most common patterns among the set of events returned by your search. Each of these patterns represents a set of events that share a similar structure.
Click on a pattern to:
- View the approximate number of events in your results that fit the pattern.
- View the search that returns events with this pattern.
- Save the pattern search as an event type, if possible. Not all event patterns can be saved as event types.
- Create an alert based on the pattern. For example, you can create alerts that trigger when certain patterns increase or decrease in frequency.
An event patterns example
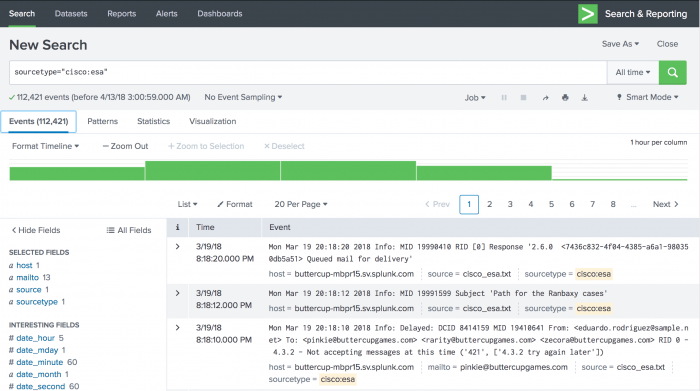
A search that uses sourcetype=cisco:esa runs for All time and returns 112,421 events.
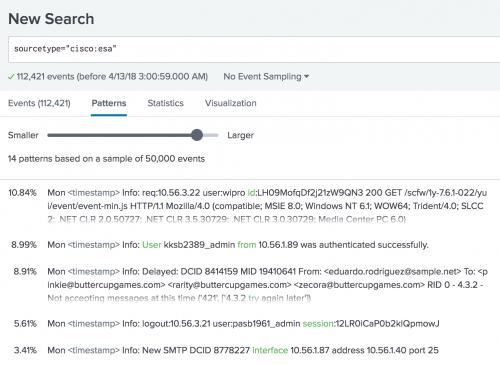
The patterns are based on a sample of 50,000 events.
To view all of the patterns in the list of events, click the Patterns tab. Initially the results identify 45 patterns. You can move the Smaller to Larger slider to change how narrow or broad the event patterns should be. If you drag the slider closer to the Larger side, 14 patterns are returned.
The threat level event pattern is the most common one. Some of the listed patterns are relatively rare in this dataset, and finding them in the Events tab listing might be difficult. The Patterns tab makes it easier to see these event patterns and save them as event types if necessary.
How the Patterns tab works
When you click the Patterns tab, Splunk software runs a secondary search on a subset of the search results that have been received up to that point. This search job analyzes those results and derives the most common event patterns in those results. It then lists those patterns in descending order from most prevalent to least prevalent. It may not include outlier patterns that are based on extremely small groups of events, because they are statistically unreliable.
The secondary search can take a long time to complete when the original dataset contains an extremely large variety of event patterns. For example, some searches return datasets containing over 500 patterns, where most of those patterns represent very small collections of events. The algorithm that identifies these patterns is designed to avoid doing too much work for small patterns, but it also attempts to be as accurate as possible.
The Patterns tab only accepts transforming searches when you set their search mode to Verbose. The Patterns tab cannot find patterns for real-time searches in any search mode.
Event pattern keywords
The Patterns tab defines patterns by the presence or absence of one or more keywords. If the keywords identified for a pattern are added to or excluded from the original search, the search returns events that fit that pattern. Keywords present in a pattern are identified with green text in the pattern list. Excluded keywords are not identified in the event list.
In the preceding event pattern example, the threat level event pattern has "threat" as its keyword, meaning that the search that returns events fitting the pattern would look like this:
sourcetype=cisco_esa threat
If this event pattern were also identified by the exclusion of the keyword "verified," the search that returns events fitting the pattern would look like this:
sourcetype=cisco_esa threat ( NOT verified )
To see all of the keywords associated with a pattern, click on the pattern.
Use the Patterns tab
1. From the Search view, run a search that returns more than 5000 results.
- Searches returning more than 5000 results produce reliable patterns.
2. Click the Patterns tab.
- You do not need to wait for the search to complete, but the pattern listing is more accurate with finalized search results.
3. (Optional) If there appear to be too many patterns or too few, or if you do not see the patterns you expect, move the slider.
- Dragging the slider to Larger runs a secondary search job that consolidates some patterns together, resulting in event patterns that represent larger numbers of events, and a wider variety of events inside each pattern group.
- Dragging the slider to Smaller runs a secondary search job that increases the granularity of the results. The event patterns it finds represent smaller numbers of events.
4. (Optional) Click on a pattern to view information for that pattern.
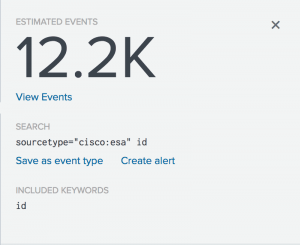
- Estimated Events is the estimated count of events in the dataset returned by the original search that fit the event pattern. In this example, the original search had 112k events. This pattern accounts for an estimated 12,200 events or 10.84% of the total number of events.
- Included Keywords identifies keywords that should be added to the base search to return the pattern. If the Patterns tab identifies keywords that should be excluded from the base search, they appear under an Excluded Keywords section.
- You can see the search that returns events fitting the event pattern under Search.
5. (Optional) In the pattern information area, click View Events to run the search displayed under Search.
- When it runs, this search uses the same time range as your original search.
6. (Optional) In the pattern information area, click Save as event type to save the search as an event type.
- Save as event type is available only for event patterns based on searches that do not include pipe characters and additional search commands. See "About event types" in this manual.
7. (Optional) In the pattern information area, click Create alert to create an alert based on the pattern.
- For example, create a scheduled alert that is triggered when the frequency of the event pattern rises above or drops below a threshold. If you know that events that fit an event pattern tend to appear at a steady rate of approximately 100 events per hour, set the alert to run on an hourly schedule and trigger when 150 or more events are returned. See the Alerting Manual.
Numbers in the Patterns tab
When the secondary search finishes, the Patterns tab displays a message explaining how many events it analyzed to obtain the displayed results.
The Patterns tab analyzes a subset of the total number of events returned by the original search. The maximum number of events in this subset is 50k. This maximum reduces processing times for the Pattern tab secondary search. If your original search returns less than 50k events, the secondary search analyzes up to 1000 events per timeline bar spanned by the original search. For example, if the original search spans 14 timeline bars, the secondary search analyzes 14,000 events to obtain its patterns listing.
You can control the maximum number of events analyzed by the secondary search by updating the maxevents setting, in the [findkeywords] stanza, in limits.conf. This setting defaults to 50000. Do not change this value. A number less than 50,000 reduces the accuracy of your events. A number higher than 50,000 increases the processing time required by the secondary search.
The estimated event count provided in the pattern information area does not apply to the number of events analyzed in the Patterns tab secondary search. It applies to the total number of events returned by the original search. If an event pattern is estimated to represent 7,350 events and the original search returned 265k events, the pattern accounts for 2.7% of the events returned by the search.
Restricting Patterns tab usage
All roles, including the user role, have permission to use the Patterns tab by default. To restrict usage of the Patterns tab, remove the pattern_detect capability. Roles without this capability do not see the Patterns tab option after they run a search.
For more information about capabilities, see "About defining roles with capabilities" in the Securing Splunk manual.
| Drill down on event details | Preview events |
This documentation applies to the following versions of Splunk® Enterprise: 7.1.0, 7.1.1, 7.1.2, 7.1.3, 7.1.4, 7.1.5, 7.1.6, 7.1.7, 7.1.8, 7.1.9, 7.1.10, 7.2.0, 7.2.1, 7.2.2, 7.2.3, 7.2.4, 7.2.5, 7.2.6, 7.2.7, 7.2.8, 7.2.9, 7.2.10, 7.3.0, 7.3.1, 7.3.2, 7.3.3, 7.3.4, 7.3.5, 7.3.6, 7.3.7, 7.3.8, 7.3.9, 8.0.0, 8.0.1, 8.0.2, 8.0.3, 8.0.4, 8.0.5, 8.0.6, 8.0.7, 8.0.8, 8.0.9, 8.0.10, 8.1.0, 8.1.1, 8.1.2, 8.1.3, 8.1.4, 8.1.5, 8.1.6, 8.1.7, 8.1.8, 8.1.9, 8.1.10, 8.1.11, 8.1.12, 8.1.13, 8.1.14, 8.2.0, 8.2.1, 8.2.2, 8.2.3, 8.2.4, 8.2.5, 8.2.6, 8.2.7, 8.2.8, 8.2.9, 8.2.10, 8.2.11, 8.2.12, 9.0.0, 9.0.1, 9.0.2, 9.0.3, 9.0.4, 9.0.5, 9.0.6, 9.0.7, 9.0.8, 9.0.9, 9.0.10, 9.1.0, 9.1.1, 9.1.2, 9.1.3, 9.1.4, 9.1.5, 9.1.6, 9.1.7, 9.1.8, 9.2.0, 9.2.1, 9.2.2, 9.2.3, 9.2.4, 9.2.5, 9.3.0, 9.3.1, 9.3.2, 9.3.3, 9.4.0, 9.4.1


 Download manual
Feedback submitted, thanks!