Monitor workload management using the monitoring console
The monitoring console provides a set of workload management dashboards that give you insight into your workload management deployment. You can use these dashboards to view configuration information, track CPU and memory resource usage, and monitor actions triggered by workload rules and admission rules.
To view workload management dashboards:
- In Splunk Web, click Settings > Monitoring Console.
- Click Resource Usage > Workload Management.
- Select from the following dashboard pages:
- Workload Management Overview
- Workload Management Activity: Instance/Deployment
- Workload Management Monitoring: Distributed
- Workload Management Admission Control: Instance/Distributed
Workload Management Overview
The Workload Management Overview dashboard displays high-level information about your workload management deployment, including information about your underlying Linux system.
The Workload Management Status panel shows whether workload management is supported and enabled on your individual Linux instances. It also displays error messages that you can use to troubleshoot issues with your system configuration.
The Workload Pool Configuration panel lists all existing workload pools and specifies which pools are currently designated as the default search pool and default ingest pool.
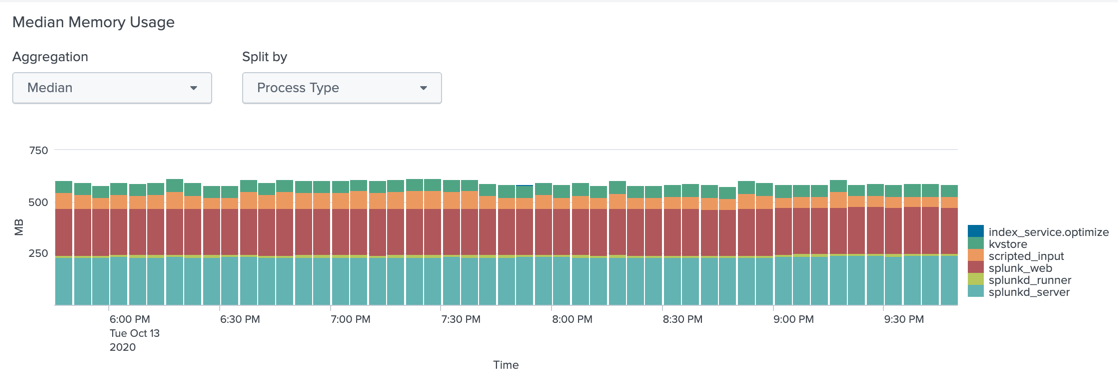
The Deployment-Wide CPU Usage by Workload Pool and Deployment-Wide Physical Memory Usage by Workload Pool panels show CPU and Memory resource consumption respectively over time on a per pool basis. You can use these panels to monitor the total amount of resources that search processes are consuming within individual workload pools.
Monitoring workload pool resource consumption can help you provision resources efficiently and help you avoid assigning too many searches to a pool, which can degrade search performance.
Memory usage is an estimate only, based on simple addition of the amount of memory used by each process in a pool. Memory shared between processes can be counted repeatedly, which can produce an overestimate of memory usage in a workload pool.
Workload Management Activity: Instance/Deployment
The Workload Management Activity: Instance and Workload Management Activity: Deployment dashboards let you monitor CPU and Memory usage of individual workload pools on a per instance basis and across a distributed deployment, respectively.
The Workload Management Pool Limits panel shows the Memory Limit setting for each workload pool, as well as the average amount of Memory and CPU resources used by each workload pool. You can use this panel to monitor memory consumption within individual pools and make sure that memory usage stays within the existing memory limit.
The Memory Usage and CPU Usage panels let you monitor Memory and CPU usage by searches and Splunk core processes within individual workload pools over a specified time range. You can use these panels to monitor resource usage within search pools by a variety of parameters, including app, role, search type, and search mode. You can also monitor resource usage within the default ingest pool by process type and individual processes.
Workload Management Monitoring: Distributed
The Workload Management Monitoring: Distributed dashboard lets you monitor stats on triggered workload rule actions, including abort, move, and alert. You can use this dashboard to monitor the frequency with which searches are triggering workload rule actions and identify searches that might require additional optimization.
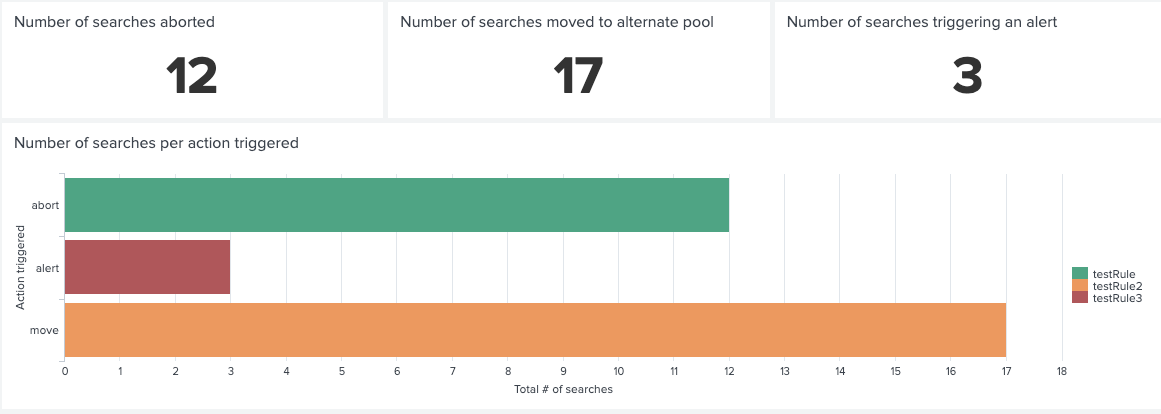
The dashboard provides a set of overview panels that show the number of searches aborted, the number of searches moved to alternate pools, and the number of searches triggering an alert over the last hour.
The Number of searches per action triggered panel shows the total number of searches that have triggered each type of action and the corresponding workload rule.
The Number of searches per action per action triggered over time shows the number of searches that have triggered an action over time and the corresponding workload rule.
The Overview of scheduled searches triggering rules panel lists each search that has triggered a workload rule action and the number of times the search has triggered the action.
For more information on workload rules, see Create workload rules.
Workload Management Admission Control: Instance/Distributed
The Workload Management Admission Control: Instance and Workload Management Admission Control: Distributed dashboards contain panels that show the number of searches that have been filtered out by admission rules on a per-instance basis and across a distributed deployment, respectively. You can use these dashboards to monitor the effectiveness of admission rules that you create to filter out searches before they are executed.
These dashboards provide a set of overview panels that show the total number of searches filtered, the number of ad hoc searches filtered, and the number of scheduled searches filtered over the last hour.
The Count of Prefiltered Searches panel lets you view the total number of searches filtered by a variety of parameters, including the admission rule, user, app, search type, search name, and instance.
The Count of Prefiltered Seaarches over time panel lets you view the the total number of searches filtered by a variety of parameters, including admission rule, user, app, and so on, over time.
The Scheduled Searches Prefiltered panel provides a list of prefiltered searches and shows the name of the triggered admission rule that prefiltered the search. It also shows the name of the instance on which the search was filtered.
For more information on admission rules, see Create admission rules to prefilter searches
| Workload management examples | Monitor workload management using the splunkd health report |
This documentation applies to the following versions of Splunk® Enterprise: 8.1.0, 8.1.1, 8.1.2, 8.1.3, 8.1.4, 8.1.5, 8.1.6, 8.1.7, 8.1.8, 8.1.9, 8.1.10, 8.1.11, 8.1.12, 8.1.13, 8.1.14, 8.2.0, 8.2.1, 8.2.2, 8.2.3, 8.2.4, 8.2.5, 8.2.6, 8.2.7, 8.2.8, 8.2.9, 8.2.10, 8.2.11, 8.2.12, 9.0.0, 9.0.1, 9.0.2, 9.0.3, 9.0.4, 9.0.5, 9.0.6, 9.0.7, 9.0.8, 9.0.9, 9.0.10, 9.1.0, 9.1.1, 9.1.2, 9.1.3, 9.1.4, 9.1.5, 9.1.6, 9.1.7, 9.1.8, 9.1.9, 9.2.0, 9.2.1, 9.2.2, 9.2.3, 9.2.4, 9.2.5, 9.2.6, 9.3.0, 9.3.1, 9.3.2, 9.3.3, 9.3.4, 9.4.0, 9.4.1, 9.4.2


 Download manual
Feedback submitted, thanks!