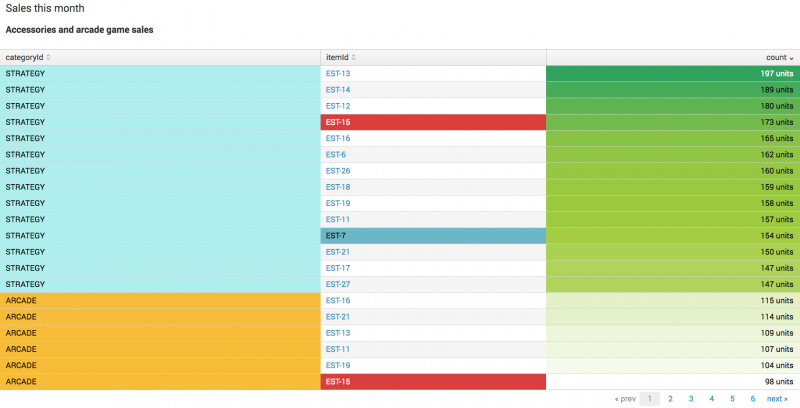
Table visualization overview
Tables can help you compare and aggregate field values. Use a table to visualize patterns for one or more metrics across a data set. Start with a query to generate a table and use formatting to highlight values, add context, or create focus for the visualization.
Create a table visualization
Learn how to generate and configure a table visualization. See the following topics for details.
| Using events lists | Generate a table |
This documentation applies to the following versions of Splunk Cloud Platform™: 9.3.2408, 8.2.2201, 8.2.2202, 8.2.2112, 9.0.2205, 8.2.2203, 9.0.2208, 9.0.2209, 9.0.2303, 9.0.2305, 9.1.2308, 9.1.2312, 9.2.2403, 9.2.2406 (latest FedRAMP release)

 Download manual
Feedback submitted, thanks!