anomalousvalue
Description
The anomalousvalue command computes an anomaly score for each field of each event, relative to the values of this field across other events. For numerical fields, it identifies or summarizes the values in the data that are anomalous either by frequency of occurrence or number of standard deviations from the mean.
For fields that are determined to be anomalous, a new field is added with the following scheme. If the field is numeric, such as size, the new field will be Anomaly_Score_Num(size). If the field is non-numeric, such as name, the new field will be Anomaly_Score_Cat(name).
Use current Splunk machine learning (ML) tools to take advantage of the latest algorithms and get the most powerful results. See About the Splunk Machine Learning Toolkit in the Splunk Machine Learning Toolkit.
Syntax
anomalousvalue <av-options>... [action] [pthresh] [field-list]
Required arguments
None.
Optional arguments
- <av-options>
- Syntax: minsupcount=<int> | maxanofreq=<float> | minsupfreq=<float> | minnormfreq=<float>
- Description: Specify one or more option to control which fields are considered for discriminating anomalies.
- Descriptions for the av-option arguments
- maxanofreq
- Syntax: maxanofreq=<float>
- Description: Maximum anomalous frequency is expressed as a floating point number between 0 and 1. Omits a field from consideration if the field is too frequently anomalous. If the ratio of anomalous occurrences of the field to the total number of occurrences of the field is greater than the
maxanofreqvalue, then the field is removed from consideration. - Default 0.05
- minnormfreq
- Syntax: minnormfreq=<float>
- Description: Minimum normal frequency is expressed as a floating point number between 0 and 1. Omits a field from consideration if the field is not anomalous frequently enough. If the ratio of anomalous occurrences of the field to the total number of occurrences of the field is smaller than p, then the field is removed from consideration.
- Default: 0.01
- minsupcount
- Syntax: minsupcount=<int>
- Description: Minimum supported count must be a positive integer. Drops a field that has a small number of occurrences in the input result set. If the field appears fewer than N times in the input events, the field is removed from consideration.
- Default: 100
- minsupfreq
- Syntax: minsupfreq=<float>
- Description: Minimum supported frequency is expressed as a floating point number between 0 and 1. Drops a field that has a low frequency of occurrence. The
minsupfreqargument checks the ratio of occurrences of the field to the total number of events. If this ratio is smaller than p the field is removed from consideration. - Default: 0.05
- action
- Syntax: action=annotate | filter | summary
- Description: Specify whether to return the anomaly score (annotate), filter out events that are not anomalous values (filter), or return a summary of anomaly statistics (summary).
- Default: filter
- Descriptions for the action arguments
- annotate
- Syntax: action=annotate
- Description: The
annotateaction adds new fields to the events containing anomalous values. The fields that are added areAnomaly_Score_Cat(field),Anomaly_Score_Num(field), or both.
- filter
- Syntax: action=filter
- Description: The
filteraction returns events with anomalous values. Events without anomalous values are removed. The events that are returned are annotated, as described foraction=annotate.
- summary
- Syntax: action=summary
- Description: The
summaryaction returns a table summarizing the anomaly statistics for each field generated. The table includes how many events contained this field, the fraction of events that were anomalous, what type of test (categorical or numerical) were performed, and so on.
Output field Description fieldnameThe name of the field. countThe number of times the field appears. distinct_countThe number of unique values of the field. meanThe calculated mean of the field values. catAnoFreq%The anomalous frequency of the categorical field. catNormFreq%The normal frequency of the categorical field. numAnoFreq%The anomalous frequency of the numerical field. stdevThe standard deviation of the field value. supportFreq%The support frequency of the field. useCatUse categorical anomaly detection. Categorical anomaly detection looks for rare values. useNumUse numerical anomaly detection. Numerical anomaly detection looks for values that are far from the mean value. This anomaly detection is Gaussian distribution based. isNumWhether or not the field is numerical.
- field-list
- Syntax: <field> ...
- Description: The List of fields to consider.
- Default: If no field list is provided, all fields are considered.
- pthresh
- Syntax: pthresh=<num>
- Description: Probability threshold (as a decimal) that has to be met for a value to be considered anomalous.
- Default: 0.01.
Usage
By default, a maximum of 50,000 results are returned. This maximum is controlled by the maxresultrows setting in the [anomalousvalue] stanza in the limits.conf file. Increasing this limit can result in more memory usage.
Only users with file system access, such as system administrators, can edit the configuration files. Never change or copy the configuration files in the default directory. The files in the default directory must remain intact and in their original location. Make the changes in the local directory.
See How to edit a configuration file.
Basic examples
1. Return only uncommon values from the search results
... | anomalousvalue
This is the same as running the following search:
...| anomalousvalue action=filter pthresh=0.01
2. Return uncommon values from the host "reports"
host="reports" | anomalousvalue action=filter pthresh=0.02
Extended example
1. Return a summary of the anomaly statistics for each numeric field
| This search uses recent earthquake data downloaded from the USGS Earthquakes website. The data is a comma separated ASCII text file that contains magnitude (mag), coordinates (latitude, longitude), region (place), etc., for each earthquake recorded.
You can download a current CSV file from the USGS Earthquake Feeds and upload the file to your Splunk instance. This example uses the All Earthquakes data from the past 30 days. |
Search for anomalous values in the earthquake data.
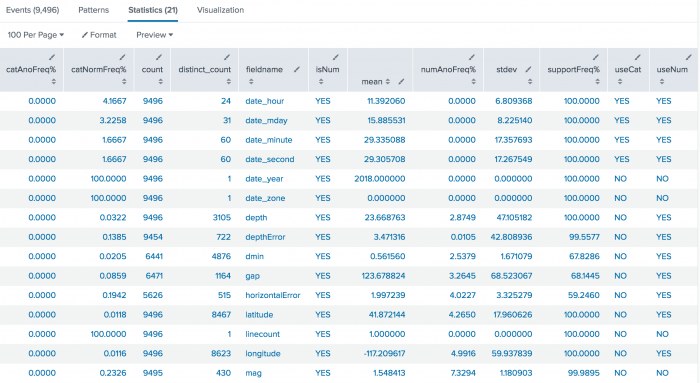
source="all_month.csv"| anomalousvalue action=summary pthresh=0.02 | search isNum=YES
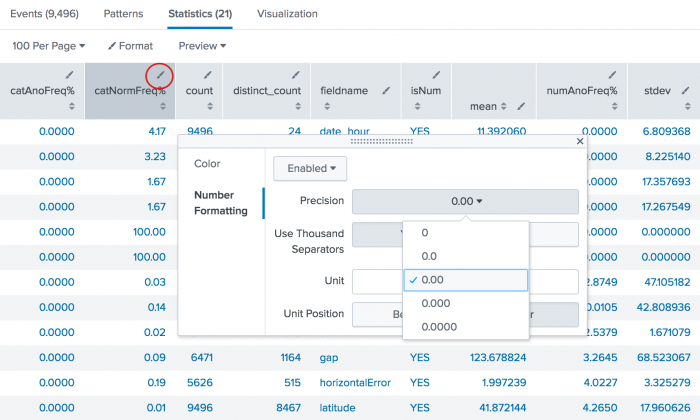
The numeric results are returned with multiple decimals. Use the field formatting icon, which looks like a pencil, to enable number formatting and specify the decimal precision to display.
See also
| anomalies | anomalydetection |
This documentation applies to the following versions of Splunk Cloud Platform™: 9.3.2411 (latest FedRAMP release), 8.2.2203, 9.0.2205, 9.0.2208, 8.2.2112, 8.2.2201, 8.2.2202, 9.0.2209, 9.0.2303, 9.0.2305, 9.1.2308, 9.1.2312, 9.2.2403, 9.2.2406, 9.3.2408


 Download manual
Feedback submitted, thanks!