geostats
Description
Use the geostats command to generate statistics to display geographic data and summarize the data on maps.
The command generates statistics which are clustered into geographical bins to be rendered on a world map.
The events are clustered based on latitude and longitude fields in the events. Statistics are then evaluated on the generated clusters. The statistics can be grouped or split by fields using a BY clause.
For map rendering and zooming efficiency, the geostats command generates clustered statistics at a variety of zoom levels in one search, the visualization selecting among them. The quantity of zoom levels is controlled by the binspanlat, binspanlong, and maxzoomlevel options. The initial granularity is selected by the binspanlat and the binspanlong. At each level of zoom, the number of bins is doubled in both dimensions for a total of 4 times as many bins for each zoom in.
Syntax
The required syntax is in bold.
- geostats
- [ translatetoxy=<bool> ]
- [ latfield=<string> ]
- [ longfield=<string> ]
- [ globallimit=<int> ]
- [ locallimit=<int> ]
- [ outputlatfield=<string> ]
- [ outputlongfield=<string> ]
- [ binspanlat=<float> binspanlong=<float> ]
- [ maxzoomlevel=<int> ]
- <stats-agg-term>...
- [ <by-clause> ]
Required arguments
- stats-agg-term
- Syntax: <stats-func> ( <evaled-field> | <wc-field> ) [AS <wc-field>]
- Description: A statistical aggregation function. See Stats function options. The function can be applied to an eval expression, or to a field or set of fields. Use the AS clause to place the result into a new field with a name that you specify. You can use wild card characters in field names. For more information on eval expressions, see Types of eval expressions in the Search Manual.
Optional arguments
- binspanlat
- Syntax: binspanlat=<float>
- Description: The size of the bins in latitude degrees at the lowest zoom level. If you set
binspanlatlower than the default value, the visualizations on the map might not render. - Default: 22.5. If the default values for
binspanlatandbinspanlongare used, a grid size of 8x8 is generated.
- binspanlong
- Syntax: binspanlong=<float>
- Description: The size of the bins in longitude degrees at the lowest zoom level. If you set
binspanlonglower than 33, the visualizations on the map might not render. - Default: 45.0. If the default values for
binspanlatandbinspanlongare used, a grid size of 8x8 is generated.
- by-clause
- Syntax: BY <field>
- Description: The name of the field to group by.
- globallimit
- Syntax: globallimit=<int>
- Description: Controls the number of named categories to add to each pie chart. There is one additional category called "OTHER" under which all other split-by values are grouped. Setting globallimit=0 removes all limits and all categories are rendered. Currently the grouping into "OTHER" only works intuitively for count and additive statistics.
- Default: 10
- locallimit
- Syntax: locallimit=<int>
- Description: Specifies the limit for series filtering. When you set
locallimit=N, the top N values are filtered based on the sum of each series. Iflocallimit=0, no filtering occurs. - Default: 10
- latfield
- Syntax: latfield=<field>
- Description: Specify a field from the pre-search that represents the latitude coordinates to use in your analysis.
- Defaults: lat
- longfield
- Syntax: longfield=<field>
- Description: Specify a field from the pre-search that represents the longitude coordinates to use in your analysis.
- Default: lon
- maxzoomlevel
- Syntax: maxzoomlevel=<int>
- Description: The maximum number of levels to create in the quadtree.
- Default: 9. Specifies that 10 zoom levels are created, 0-9.
- outputlatfield
- Syntax: outputlatfield=<string>
- Description: Specify a name for the latitude field in your geostats output data.
- Default: latitude
- outputlongfield
- Syntax: outputlongfield=<string>
- Description: Specify a name for the longitude field in your geostats output data.
- Default: longitude
- translatetoxy
- Syntax: translatetoxy=<bool>
- Description: If true, geostats produces one result per each locationally binned location. This mode is appropriate for rendering on a map. If false, geostats produces one result per category (or tuple of a multiply split dataset) per locationally binned location. Essentially this causes the data to be broken down by category. This mode cannot be rendered on a map.
- Default: true
Stats function options
- stats-func
- Syntax: The syntax depends on the function that you use. See Usage.
- Description: Statistical and charting functions that you can use with the
geostatscommand. Each time you invoke thegeostatscommand, you can use one or more functions.
Usage
To display the information on a map, you must run a reporting search with the geostats command.
If you are using a lookup command before the geostats command, see Optimizing your lookup search.
Supported functions
You can use a wide range of functions with the geostats command. For general information about using functions, see Statistical and charting functions.
- For a list of statistical functions by category, see Function list by category
- For an alphabetical list of statistical functions, see Alphabetical list of functions
Memory and geostats search performance
A pair of limits.conf settings strike a balance between the performance of geostats searches and the amount of memory they use during the search process, in RAM and on disk. If your geostats searches are consistently slow to complete you can adjust these settings to improve their performance, but at the cost of increased search-time memory usage, which can lead to search failures.
For more information, see Memory and stats search performance in the Search Manual.
Basic examples
1. Use the default settings and calculate the count
Cluster events by default latitude and longitude fields "lat" and "lon" respectively. Calculate the count of the events.
... | geostats count
2. Specify the latfield and longfield and calculate the average of a field
Compute the average rating for each gender after clustering/grouping the events by "eventlat" and "eventlong" values.
... | geostats latfield=eventlat longfield=eventlong avg(rating) by gender
Extended examples
3. Count each product sold by a vendor and display the information on a map
| This example uses the sample data from the Search Tutorial. To try this example on your own Splunk instance, you must download the sample data and follow the instructions to get the tutorial data into Splunk. Use the time range All time when you run the search.
|
This search uses the stats command to narrow down the number of events that the lookup and geostats commands need to process.
Use the following search to count each product sold by a vendor and display the information on a map.
sourcetype=vendor_sales | stats count by Code VendorID | lookup prices_lookup Code OUTPUTNEW product_name | table product_name VendorID | lookup vendors_lookup VendorID | geostats latfield=VendorLatitude longfield=VendorLongitude count by product_name
- In this example,
sourcetype=vendor_salesis associated with a log file that is included in the Search Tutorial sample data. This log file contains vendor information that looks like this:
[10/Apr/2018:18:24:02] VendorID=5036 Code=B AcctID=6024298300471575
- The
vendors_lookupis used to output all the fields invendors.csvfile that match to the VentorID in the vendor_sales.log file. The fields in thevendors.csvfile are : Vendor, VendorCity, VendorID, VendorLatitude, VendorLongitude, VendorStateProvince, and VendorCountry. - The
prices_lookupis used to match the Code field in each event to a product_name in the table.
In this search, the CSV files are uploaded and the lookups are defined but are not automatic.
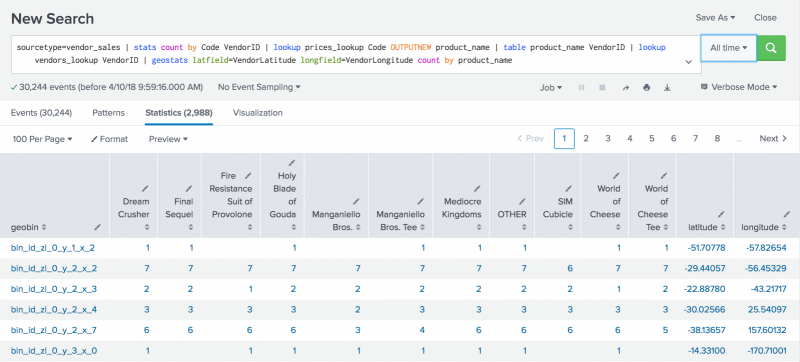
This search produces a table displayed on the Statistics tab:
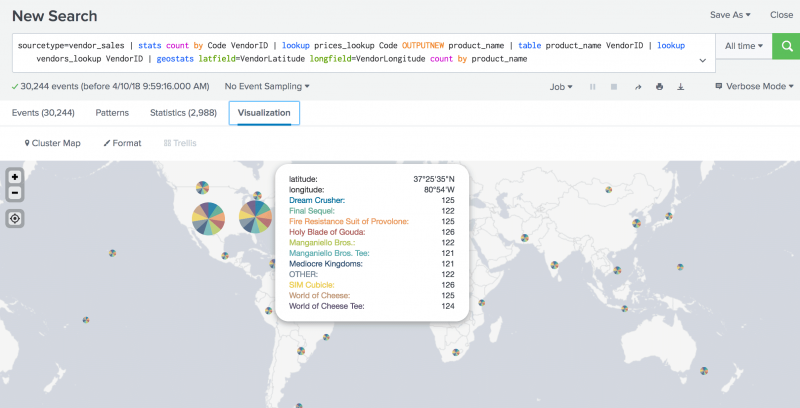
Click the Visualization tab. The results are plotted on a world map. There is a pie chart for each vendor in the results. The larger the pie chart, the larger the count value.
In this screen shot, the mouse pointer is over the pie chart for a region in the northeastern part of the United States. An popup information box displays the latitude and longitude for the vendor, as well as a count of each product that the vendor sold.
You can zoom in to see more details on the map.
See also
- Commands
- iplocation
- stats
- xyseries
- Reference information
- Mapping data in Dashboards and Visualizations
| geomfilter | head |
This documentation applies to the following versions of Splunk Cloud Platform™: 9.3.2411 (latest FedRAMP release), 8.2.2203, 9.0.2205, 9.0.2208, 8.2.2112, 8.2.2201, 8.2.2202, 9.0.2209, 9.0.2303, 9.0.2305, 9.1.2308, 9.1.2312, 9.2.2403, 9.2.2406, 9.3.2408


 Download manual
Feedback submitted, thanks!