Part 9 Add a drilldown
Focus your data for one particular game across different visualizations with an interactive token. For this part of the tutorial, add a drilldown by setting a token on the pie chart.
- Select the pie chart visualization. Then, select + Add Drilldown in the Drilldown Settings section of the Configuration panel.
- In the On Click dropdown, select Set Tokens.
- Select + Set Another Token.
- Give your token the following name and values:
- Token Name: game
- Token Value: row.Game.value
- Default Value: SIM Cubicle
- Select Apply.
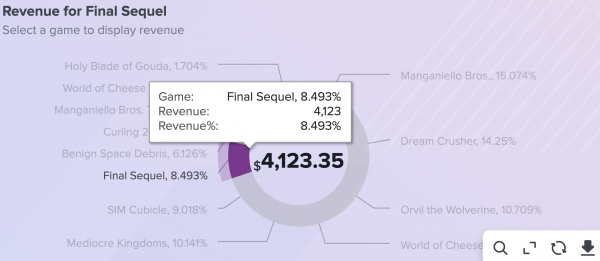
- In the configuration panel, change the pie chart's title to Revenue for $game$.
- Change the description to Select a game to display revenue.
- In the visual editor, select Save then View.
- Select a game from the pie chart and see the title update. The token sets when you select a specific slice of the pie chart.
- Return to Edit mode by selecting Edit in the top right corner.
- Select the single value visualization.
- In the Data Configurations section, select the edit icon (
 ) next to the Total Revenue data source.
 - Add your drilldown token to the search by copying and pasting the following SPL before
|stats sum(Revenue) as "Total Revenue":| search Game="$game$"
- Select Apply & Close.
- Select the markdown inside the hole of the pie chart above the single value.
- Change the text box to #### Revenue.
- Select the pie chart. Then, select the layer icon (
 ) and choose Bring to Front.
After completing Part 9, your dashboard looks similar to this:

Next step
You've completed Part 9 of the Splunk Dashboard Studio tutorial.
Now you can set tokens on visualizations. Next, use the source code editor to customize your charts. Continue to Part 10: Apply customization options with dashboard default settings.
| Part 8 Add an input | Part 10 Apply customization options with dashboard default settings |
This documentation applies to the following versions of Splunk Cloud Platform™: 8.2.2203, 9.0.2205, 9.0.2208, 9.0.2209
 Download manual
Feedback submitted, thanks!