Preview observability data in the Related Content panel
With Splunk Observability Cloud Related Content, you can see previews of Splunk Observability Cloud data and context that are related to an event you are investigating in the Splunk Cloud Platform Search & Reporting application.
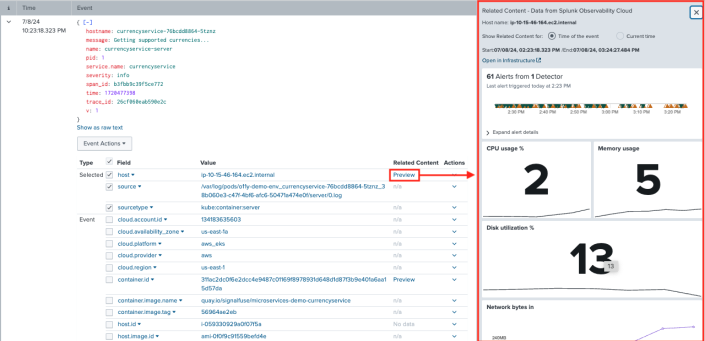
The following example shows previews of host data from Splunk Observability Cloud on the Related Content panel:
In a Related Content side panel, you can examine three correlated fields from Splunk Observability Cloud: trace, application service, and infrastructure. You can also monitor Kubernetes clusters, containers, pods, and nodes. If necessary, you can jump directly to the specific correlated view in Splunk Observability Cloud to drill down on problems in detail. You can accelerate troubleshooting by identifying and solving problems faster, reducing overall mean time to resolution.
The Related Content panel shows the following Splunk Observability Cloud data previews:
| Splunk Cloud Platform field | Splunk Observability Cloud related data |
|---|---|
| host.name | CPU utilization, memory usage, disk utilization, network bytes in, network bytes out, tags |
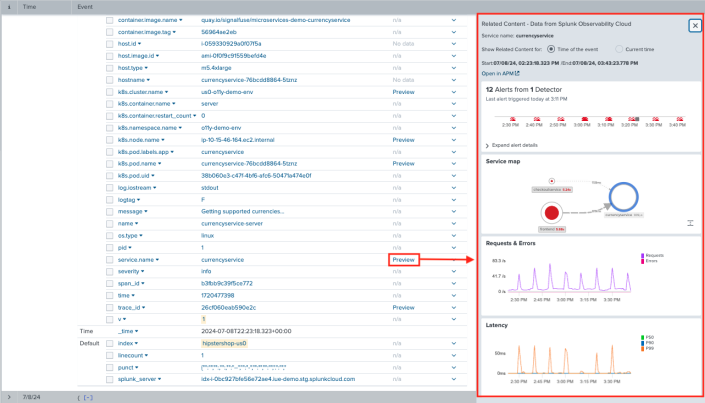
| service.name | Service dependency map, latency graph, error rate graph |
| trace_id | Errors, trace duration, service errors, top 10 operations |
| k8s.cluster.name | Nodes, total memory (bytes), top nodes by pods, top nodes by CPU capacity usage (%), top nodes by memory usage (bytes) |
| container.id | CPU usage (CPU units), memory usage (bytes), filesystem usage (bytes) |
| k8s.pod.name | Active containers, network bytes/sec, CPU usage per pod (CPU units), memory usage (%) |
| k8s.node.name | Pods, total memory (bytes), node condition, CPU cores, top 10 CPU used per pod (%), top 10 memory used per pod (bytes), node workloads, tags |
Region and version availability
The following sections list the regions in which you can use Related Content.
Splunk Observability Cloud
Related Content is available for the following Splunk Observability Cloud regions:
| AWS regions | Google Cloud Platform regions |
|---|---|
|
|
Splunk Cloud Platform
Related Content is available for the following Splunk Cloud Platform regions:
| Service component | AWS regions | Google Cloud Platform regions |
|---|---|---|
| Victoria experience |
|
Not currently available |
| Classic experience |
|
|
Prerequisites
To see related Splunk Observability Cloud data in the Search app, a Splunk Cloud Platform user with the sc_admin role must do the following:
- Connect your Splunk Cloud Platform and Splunk Observability Cloud instances. See Set up Splunk Observability Cloud previews in Splunk Cloud Platform to learn how.
- Give the appropriate Splunk Cloud Platform users the capability read_o11y_content. Only users with the read_o11y_content capability in Splunk Cloud Platform can see data from Splunk Observability Cloud.
If you are using the Firefox extension uBlock Origin, turn it off. Otherwise, uBlock Origin blocks Splunk Observability Cloud previews.
View Splunk Observability Cloud Related Content in the Search app
To see previews of observability data that correlate with Splunk Cloud Platform logs, follow these steps:
1. Log in to your Splunk Cloud Platform instance and perform any search on your logs data.
2. Select an individual log of interest.
3. Scroll down the list of log fields. Under the Related Content column, find Preview links next to host.name, service.name, or trace_id fields.
4. Select a preview.
5. The Related Content panel appears, showing a summary of important data related to the host, service name, or trace you selected. In the following example, the user selects a preview of the service name, currencyservice. The Related Content panel displays a preview of currencyservice in the Splunk APM service map, showing immediate dependencies.
If observability preview data is not visible
If you are not seeing observability data in the Search & Reporting app for host, service, or trace data and you think you should, check that you Auto Field Mapping is activated. You might have names for host, service, and trace id that do not match names for those fields in Splunk Observability Cloud. See the Field aliasing section of Configure Splunk Observability Cloud to learn how to turn on Auto Field Mapping. You can also see which variations on field names automatically map to Splunk Observability Cloud field names.
| Configure Splunk Observability Cloud previews | Troubleshoot Related Content previews |
This documentation applies to the following versions of Splunk Cloud Platform™: 9.1.2312, 9.2.2403, 9.2.2406, 9.3.2408, 9.3.2411 (latest FedRAMP release)


 Download manual
Feedback submitted, thanks!