Informational Dashboards
Splunk App for Stream provides a set of built-in informational dashboards, including:
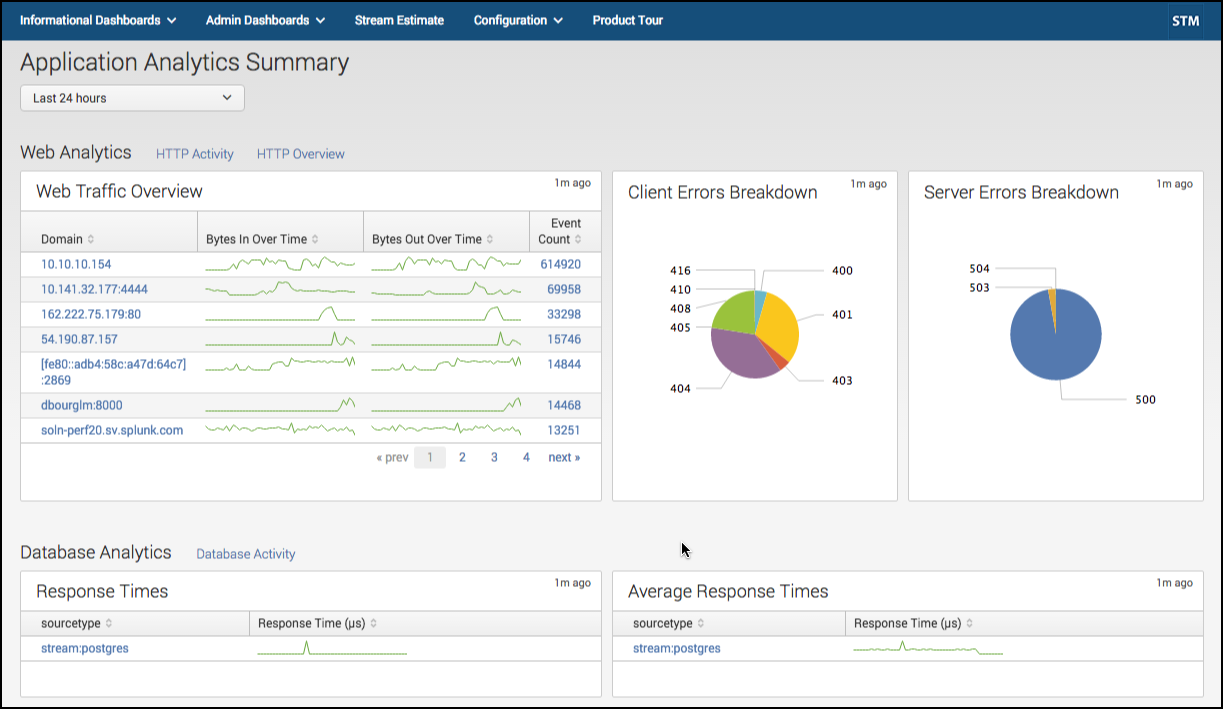
- Application Analytics Summary
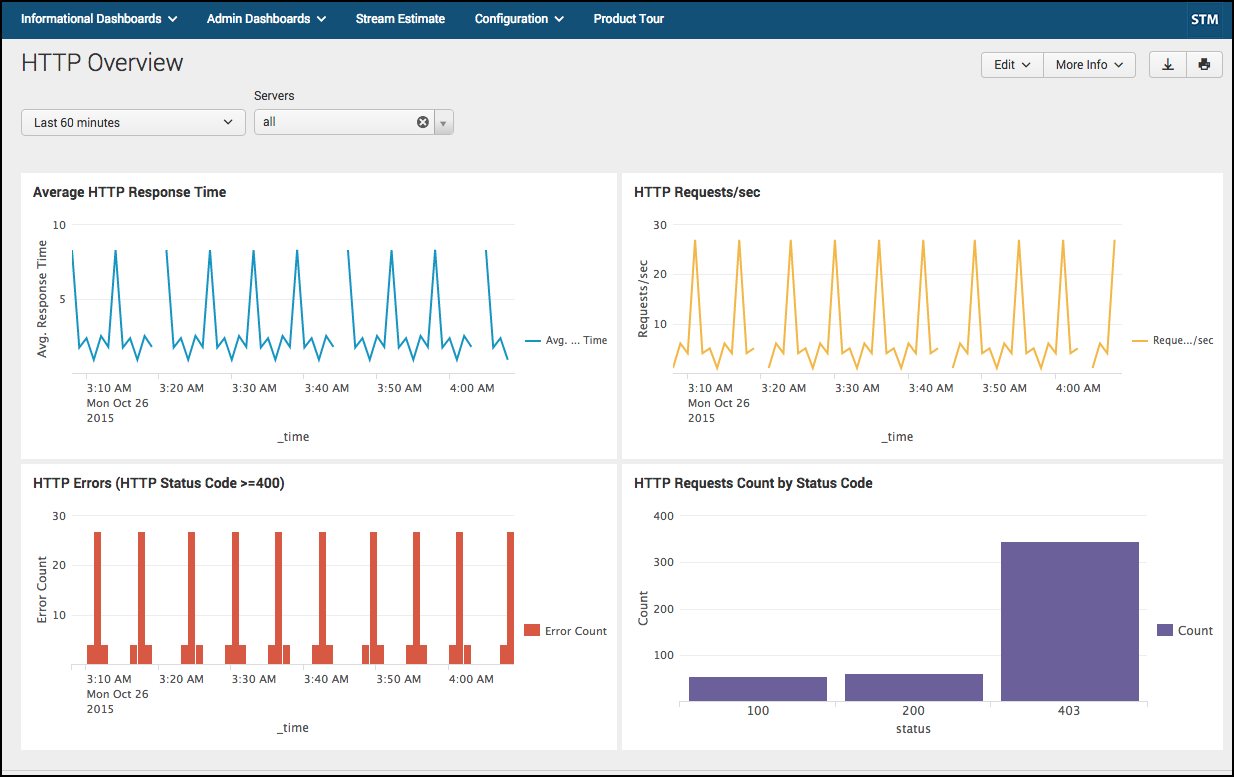
- HTTP Overview
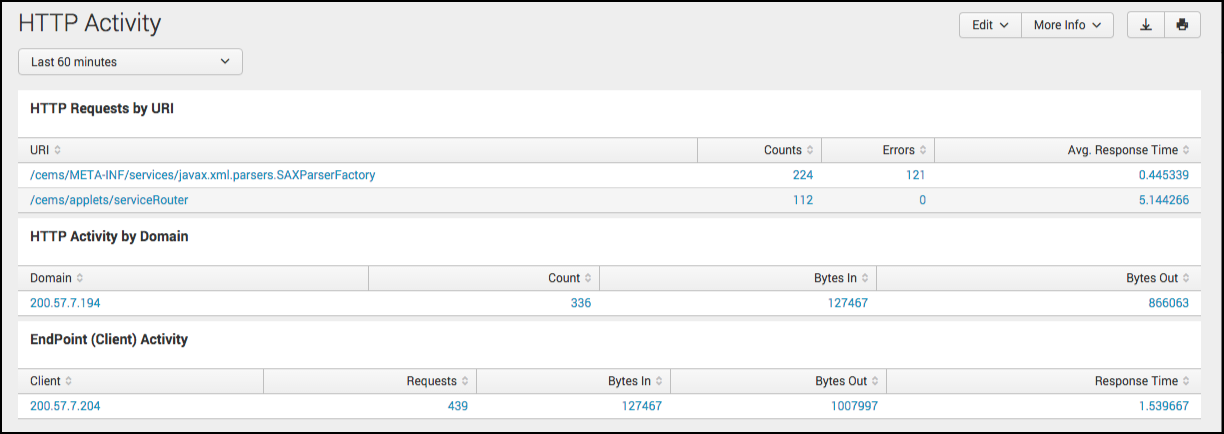
- HTTP Activity
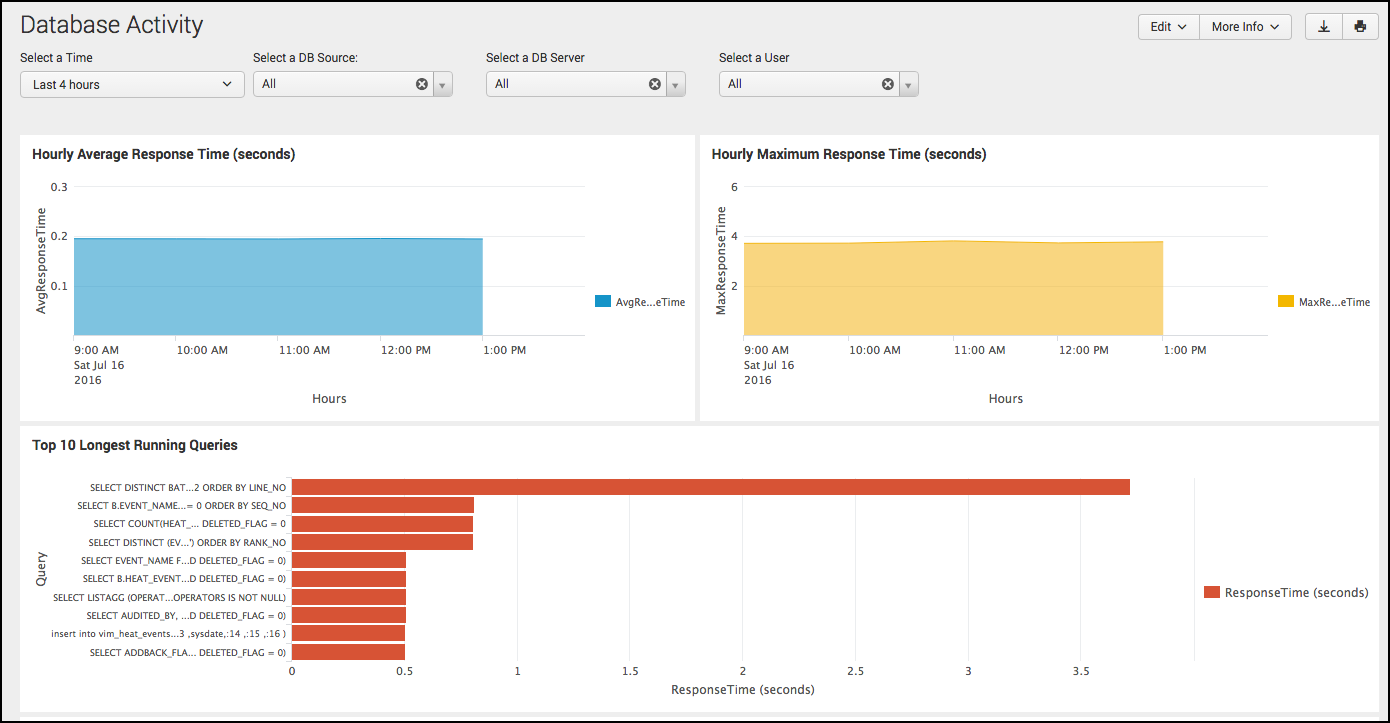
- Database Activity
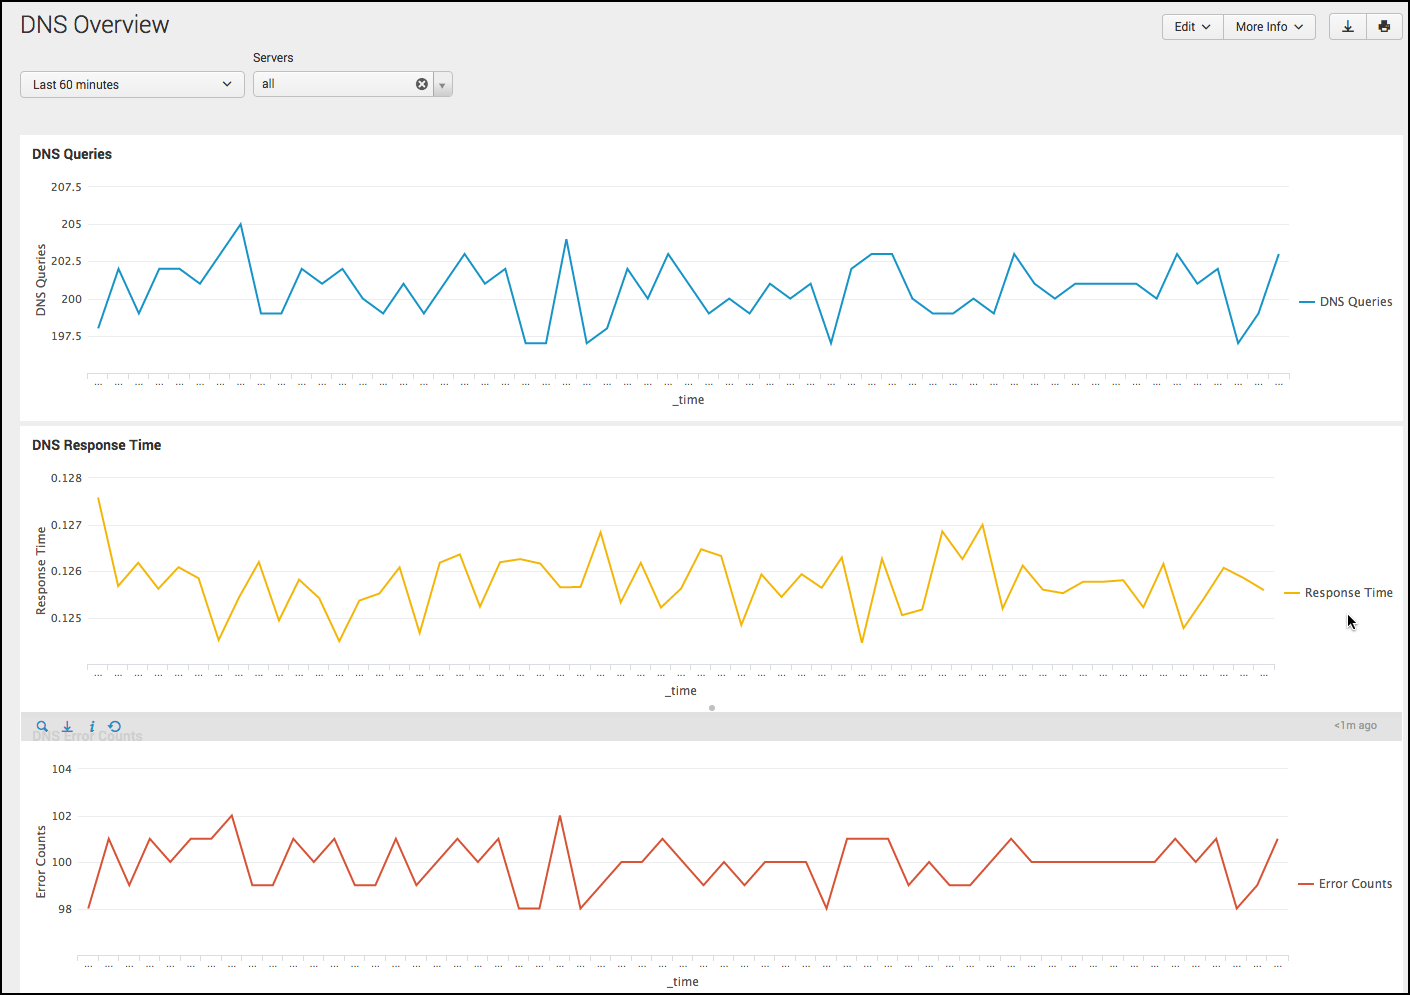
- DNS Overview
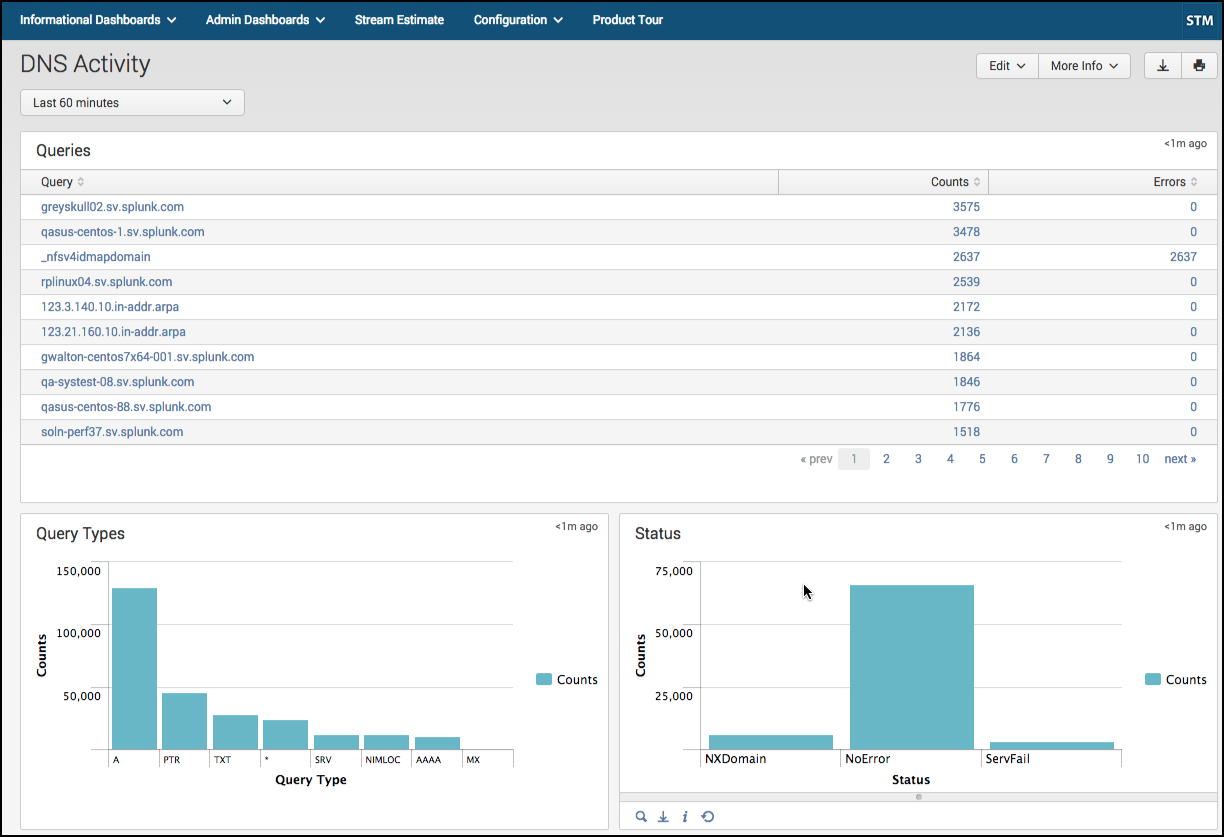
- DNS Activity
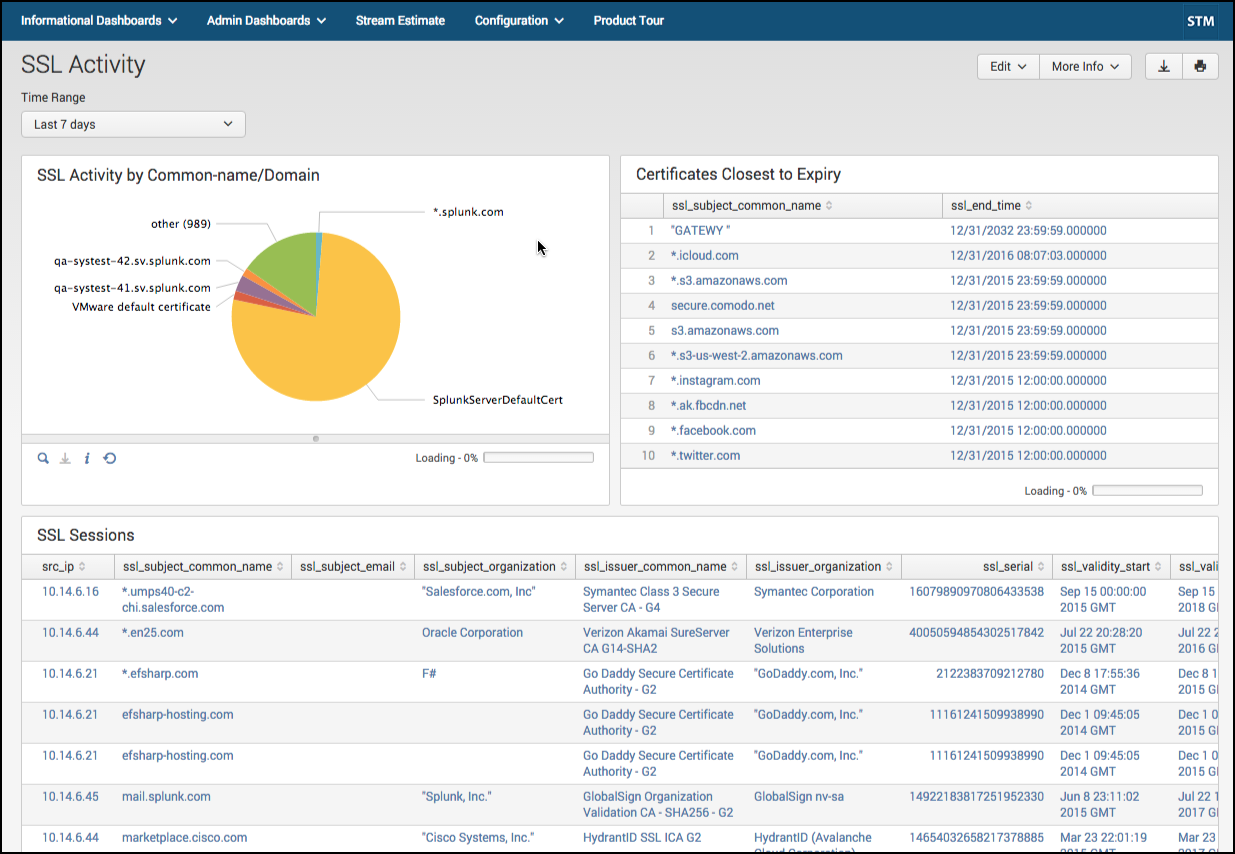
- SSL Activity
Informational dashboards are populated by a set of built-in streams that come with the app. You can clone built-in streams to create new streams in the Configure Streams UI. For more information, see Configure Streams in this manual.
Use these informational dashboards to get a quick overview of activities taking place on your network:
Application Analytics Summary
HTTP Overview
HTTP Activity
Database Activity
DNS Overview
DNS Activity
SSL Activity
| Stream Estimate | Admin Dashboards |
This documentation applies to the following versions of Splunk Stream™: 6.4.0, 6.4.1, 6.4.2
 Download manual
Feedback submitted, thanks!