Stream Estimate
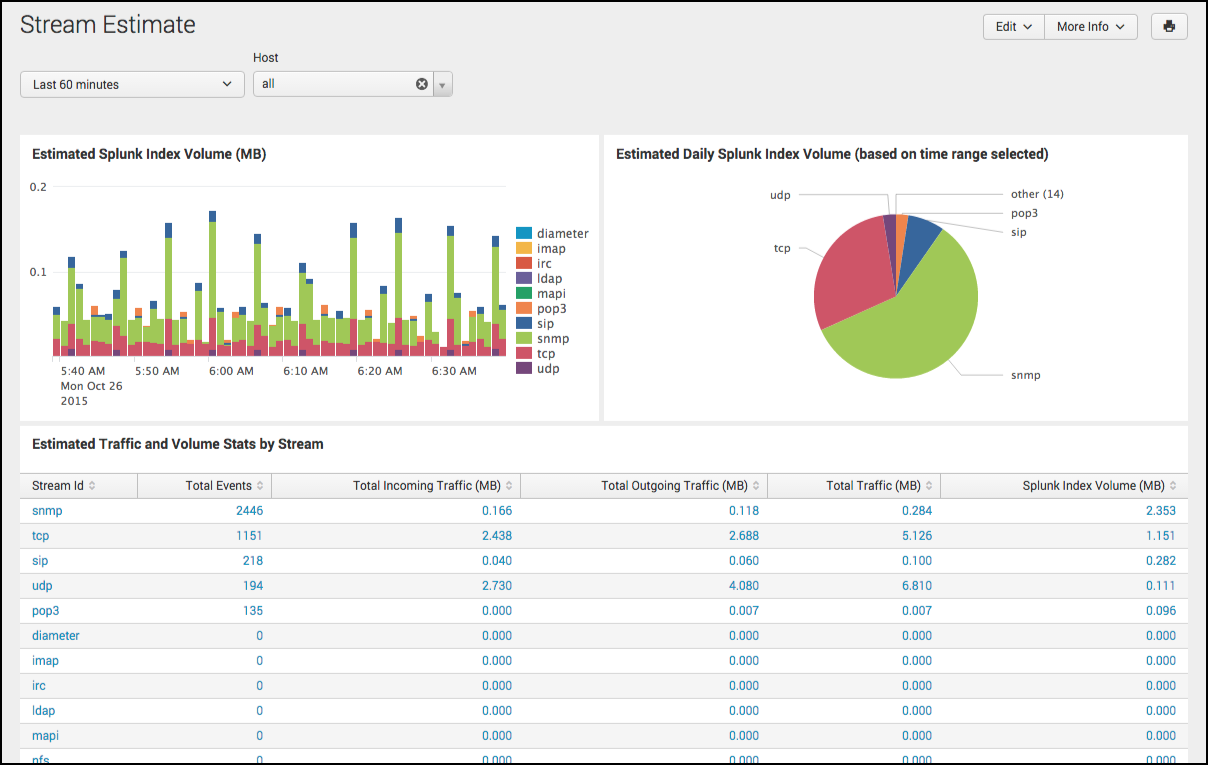
The Stream Estimate dashboard shows index volume stats for all streams in the Estimate mode. Streams in the Estimate mode generate data index volume stats, without sending the actual data to your indexers.
The Stream Estimate dashboard lets you monitor these data index volume stats:
- Total Events
- Total Incomming Traffic (MB)
- Total Outgoing Traffic (MB)
- Total Traffic (MB)
- Spunk Index Volume (MB)
The Stream Estimate dashboard provides a preview of the amount of data that you might need to index for any stream. This can help you calculate your indexer requirements, and fine-tune your stream configurations so that you capture only the specific data that you require for analysis.
To access the Stream Estimate dashboard:
In the Splunk App for Stream main menu, click Stream Estimate.
Note: Streams in the Enabled mode generate data index volume stats based on the actual amount of data sent to your indexers. You can view index volume stats for all enabled streams in the Stream Data Volumes dashboard. For more information, see "Admin Dashboards" in this manual.
For more information on the Estimate mode, see "Configure Streams" in this manual.
| Distributed Forwarder Management | Informational Dashboards |
This documentation applies to the following versions of Splunk Stream™: 6.4.0, 6.4.1, 6.4.2

 Download manual
Feedback submitted, thanks!