Hardware performance tests and considerations
This page provides hardware performance test results for Splunk App for Stream version 6.5.1. Test results shows CPU usage and Memory usage of splunkd and streamfwd for HTTP and TCP traffic from universal forwarders over a wide range of bandwidths, both with and without SSL. Also included are test results for Independent Stream Forwarder (streamfwd) sending data to indexers using HTTP Event Collector (HEC).
Test environment
- All tests are performed on servers with:
- CentOS 6.7 (64-bit).
- Dual Intel Xeon E5-2698 v3 CPUs (16 2.3Ghz cores; 32 cores total).
- 64 GB RAM.
- Stream Forwarder 6.5.1.
HTTP 100K Response Test
- Traffic is generated using ixia PerfectStorm device:
- 1000 concurrent flows.
- Network neighborhood has 1000 client IPs, 1000 server IPs.
- A single superflow is used with one request and one 100K response.
- A single TCP connection is used for each superflow (no Keep-Alive).
- Default
splunk_app_streamconfiguration. - Default Stream Forwarder
streamfwdconfiguration except:- Tests up to 1Gbps:
- ProcessingThreads = 2
- One Intel 10 GB device
- Tests from 2-6 Gbps:
- ProcessingThreads = 8
- Two Intel 10 GB devices (traffic is evenly load balanced using ixia packet broker).
- Tests for 6+ Gbps:
- ProcessingThreads = 16
- Four Intel 10 GB devices (traffic is evenly load balanced using ixia packet broker).
- Tests up to 1Gbps:
Results for HTTP 100K Response Test
| Stat | 8 Mbps | 64 Mbps | 256 Mbps | 512 Mbps | 1 Gbps | 2 Gbps | 3 Gbps | 4 Gbps | 5 Gbps | 6 Gbps | 7 Gbps | 8 Gbps | 9 Gpbs | 10 Gbps |
|---|---|---|---|---|---|---|---|---|---|---|---|---|---|---|
| CPU% (splunkd) | 1 | 6 | 6 | 1 | 5.4 | 5 | 5.9 | 1 | 6 | 5 | 5 | 5 | 6 | 7 |
| Memory MB (splunkd) | 156 | 157 | 157 | 157 | 157 | 156 | 156 | 157 | 156 | 157 | 155 | 156 | 154 | 155 |
| CPU% (streamfwd) | 7 | 15 | 27 | 40 | 62.9 | 177 | 232.7 | 301.6 | 428 | 503 | 762 | 883 | 1007 | 1230 |
| Memory MB (streamfwd) | 167 | 170 | 176 | 185 | 193 | 373 | 385 | 401 | 413 | 440 | 913 | 927 | 964 | 1463 |
| Drop Rate % | 0+ | 0+ | 0.01 | 0+ | 0+ | 0.01 | 0.06 |
Note: Drop Rate = % of received packets that had to be dropped. 0+ indicates that it is non-zero but < 0.01%, so rounds to zero.
HTTP 25K Response Test
- Traffic is generated using ixia PerfectStorm device:
- 1000 concurrent flows.
- Network neighborhood has 1000 client IPs, 1000 server IPs.
- A single superflow is used with one request and one 25K response.
- A single TCP connection is used for each superflow (no Keep-Alive).
- Default
splunk_app_streamconfiguration. - Default Stream Forwarder
streamfwdconfiguration except:- Tests up to 512Mbps:
- ProcessingThreads = 2
- One Intel 10 GB device
- Tests for 1-3 Gbps:
- ProcessingThreads = 8
- Two Intel 10 GB devices (traffic is evenly load balanced using ixia packet broker)
- Tests for 4-5 Gbps:
- ProcessingThreads = 16
- Four Intel 10 GB devices (traffic is evenly load balanced using ixia packet broker)
- Tests for 6+ Gbps:
- Encountered errors and/or high Drop Rate.
- Tests up to 512Mbps:
Results for HTTP 25K Response Test
| Stat | 8 Mbps | 64 Mbps | 256 Mbps | 512 Mbps | 1 Gbps | 2 Gbps | 3 Gbps | 4 Gbps | 5 Gbps |
|---|---|---|---|---|---|---|---|---|---|
| CPU% (splunkd) | 1 | 1 | 1 | 1 | 5 | 2 | 4.9 | 3 | 1.4 |
| Memory MB (splunkd) | 156 | 158 | 158 | 160 | 155 | 155 | 155 | 159 | 158 |
| CPU% (streamfwd) | 11 | 22 | 40 | 65.9 | 187 | 351 | 561 | 1250 | 1692.1 |
| Memory MB (streamfwd) | 170 | 172 | 176 | 183 | 327 | 342 | 358 | 836 | 2486 |
| Drop Rate % | 0 | 0 | 0 | 0 | 0 | 0 | 0 | 0+ | 0.01 |
HTTPS 100K ResponseTest
- Traffic is generated using ixia PerfectStorm device:
- 4000 concurrent flows.
- Network neighborhood has 1000 client IPs, 1000 server IPs.
- A single superflow is used with five requests and five 100K responses (Keep-Alive with ratio of 1:5 connections:requests).
- Default
splunk_app_streamconfiguration. - Default Stream Forwarder
streamfwdconfiguration except:- SessionKeyTimeout = 30
- Tests at 1Gbps:
- ProcessingThreads = 2
- One Intel 10 GB device
- Tests for 2-4 Gbps:
- ProcessingThreads = 16
- Four Intel 10 GB devices (traffic is evenly load balanced using ixia packet broker)
- Tests for 5+ Gbps:
- We were unable to generate realistic SSL tests for more than 4Gbps on Ixia.
Results for HTTPS 100K Response Test
| Stat | 8 Mbps | 64 Mbps | 256 Mbps | 512 Mbps | 1 Gbps | 2 Gbps | 3 Gbps | 4 Gbps |
|---|---|---|---|---|---|---|---|---|
| CPU% (splunkd) | 1 | 5.5 | 5.5 | 6 | 1 | 1.5 | 1.5 | 2.5 |
| Memory MB (splunkd) | 155 | 156 | 157 | 157 | 158 | 163 | 164 | 163 |
| CPU% (streamfwd) | 11 | 30 | 59 | 102 | 273 | 664 | 903 | 1269 |
| Memory MB (streamfwd) | 220 | 229 | 240 | 255 | 442 | 849 | 885 | 938 |
| Drop Rate % | 0 | 0 | 0 | 0 | 0 | 0 | 0 | 0+ |
HTTP 100K TCP-only Response Test
- Traffic is generated using ixia PerfectStorm device:
- 1000 concurrent flows.
- Network neighborhood has 1000 client IPs, 1000 server IPs.
- A single superflow is used with one request and one 100K response.
- A single TCP connection is used for each superflow (no Keep-Alive).
- Default
splunk_app_streamconfiguration except:- tcp stream "enabled", all other streams are "disabled."
- Default Stream Forwarder
streamfwdconfiguration except:- Tests up to 1Gbps:
- ProcessingThreads = 2
- One Intel 10 GB device
- Tests for 2-3 Gbps:
- ProcessingThreads = 8
- Two Intel 10 GB devices (traffic is evenly load balanced using ixia packet broker).
- Tests for 4-6 Gbps:
- ProcessingThreads = 16
- Four Intel 10 GB devices (traffic is evenly load balanced using ixia packet broker).
- Tests for 6+ Gbps:
- Encountered errors and/or high Drop Rate.
- Tests up to 1Gbps:
Results for HTTP 100K TCP-only Response Test
| Stat | 8 Mbps | 64 Mbps | 256 Mbps | 512 Mbps | 1 Gbps | 2 Gbps | 3 Gbps | 4 Gbps | 5 Gbps | 6 Gbps |
|---|---|---|---|---|---|---|---|---|---|---|
| CPU% (splunkd) | 1.5 | 2 | 5.5 | 9.5 | 17 | 32.5 | 52 | 89 | 107 | 125.9 |
| Memory MB (splunkd) | 157 | 157 | 157 | 158 | 158 | 157 | 159 | 158 | 156 | 161 |
| CPU% (streamfwd) | 7 | 12 | 23 | 34 | 57.9 | 142 | 221 | 404 | 503 | 583 |
| Memory MB (streamfwd) | 166 | 167 | 169 | 177 | 184 | 349 | 375 | 892 | 938 | 963 |
| Drop Rate % | 0 | 0 | 0 | 0 | 0 | 0 | 0 | 0+ | 0* | 0* |
Combined CPU usage streamfwd and splunkd
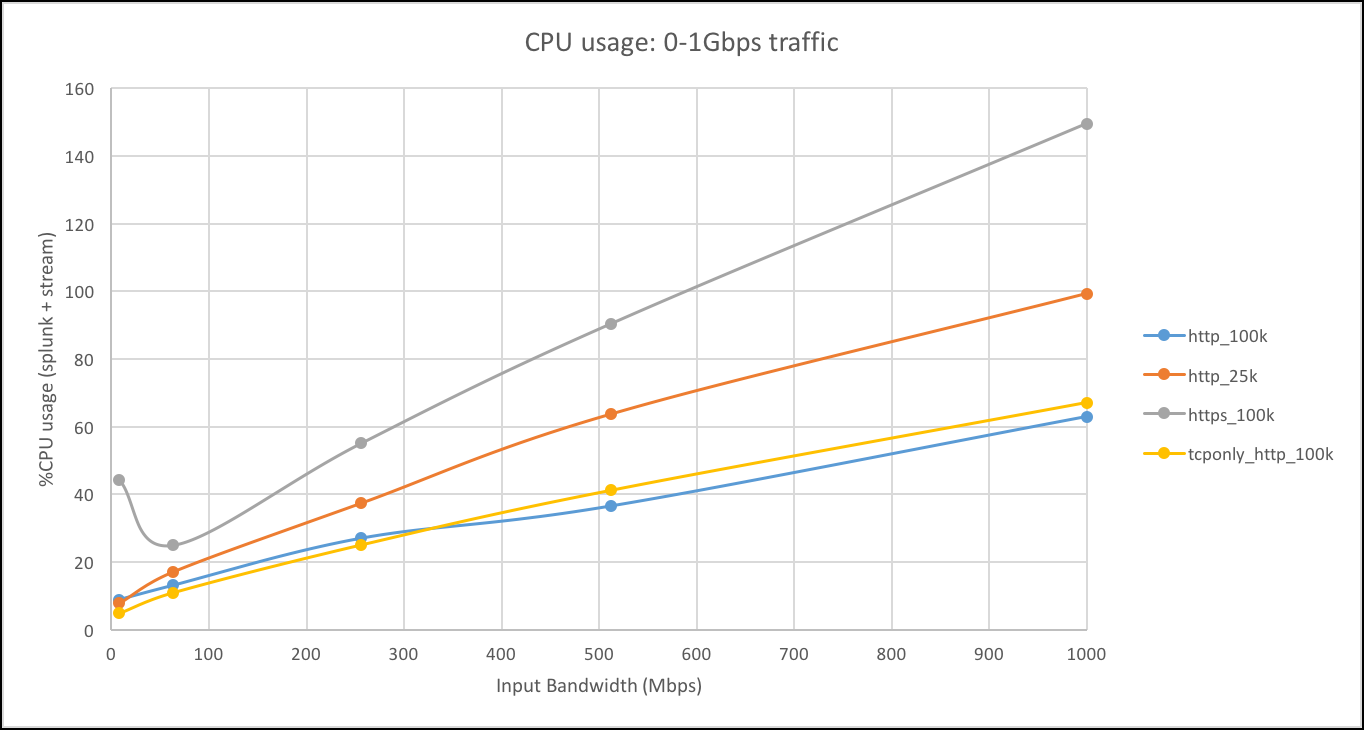
The following chart shows combined CPU usage (single core %) of streamfwd and splunkd for 0-1GBps traffic for each of the four configuration+workload combinations that we ran.
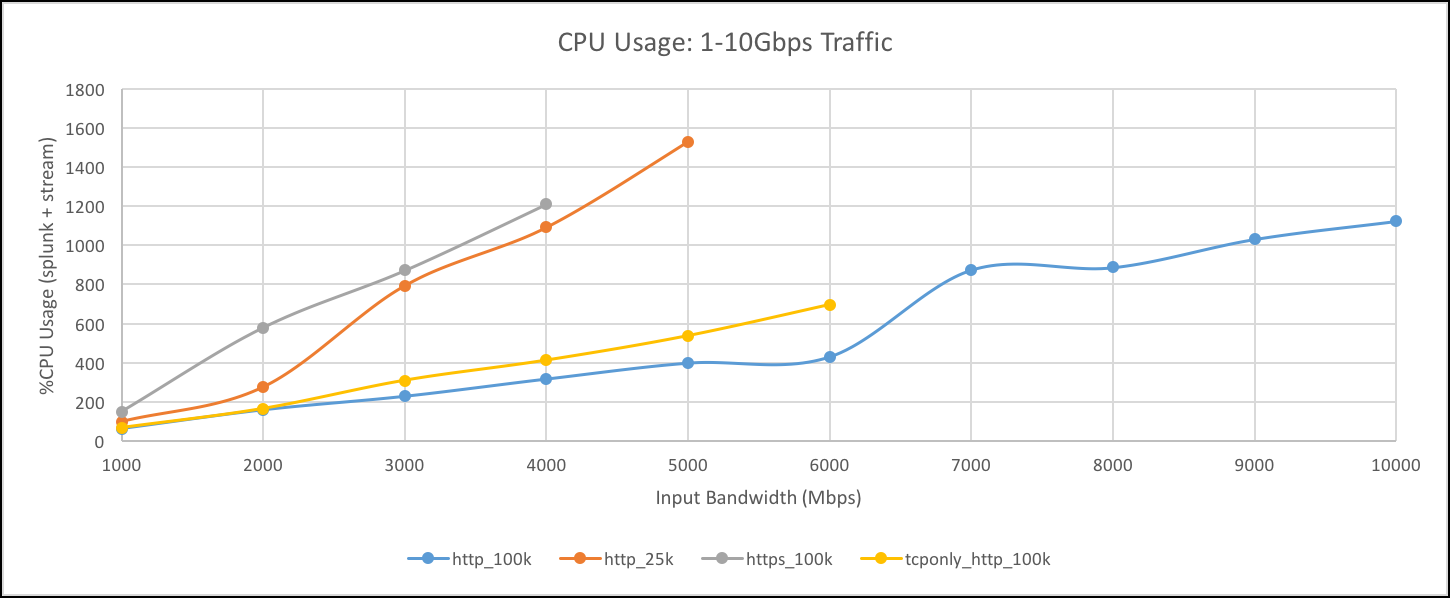
The following chart shows combined CPU usage (single core %) of streamfwd and splunkd for 1-10Gbps traffic for each of the four configuration+workload combinations that we ran.
Combined memory usage streamfwd and splunkd
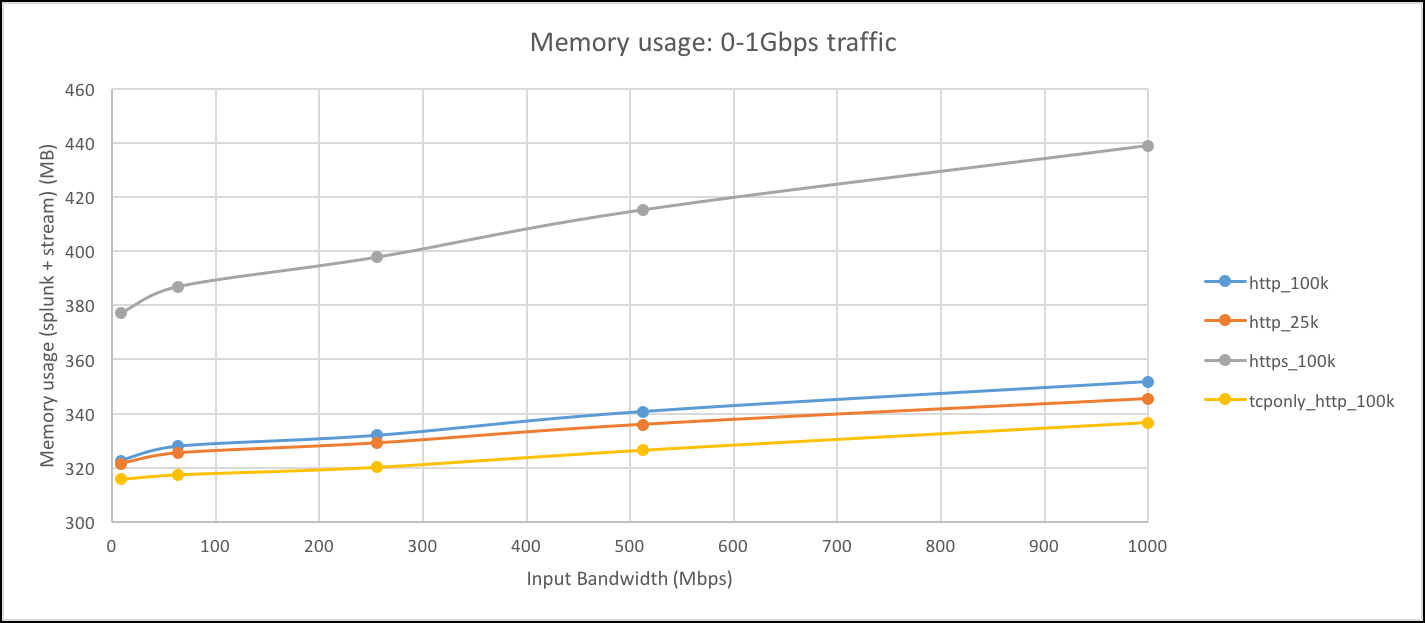
The following chart shows combined memory usage (MB) of streamfwd and splunkd for 0-1Gbps traffic for each of the four configuration+workload combinations that we ran.
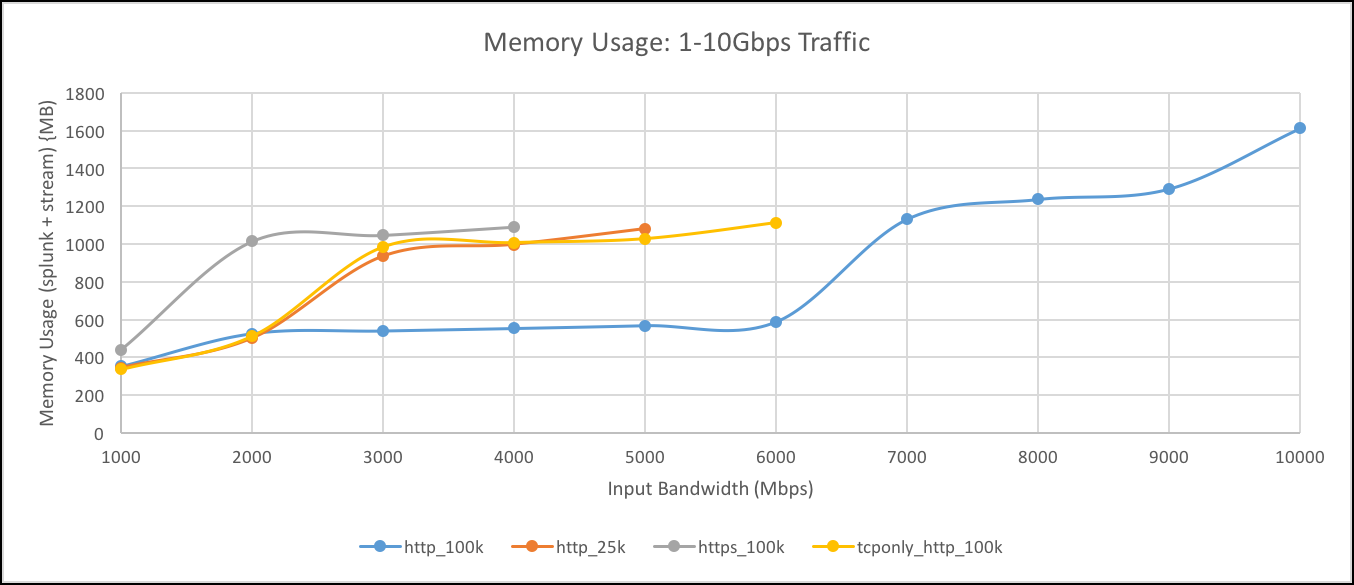
The following chart shows combined memory usage (MB) of streamfwd and splunkd for 1-10Gbps traffic for each of the four configuration+workload combinations that we ran.
Note: Hardware performance test results represent maximum values.
Independent Stream Forwarder Test
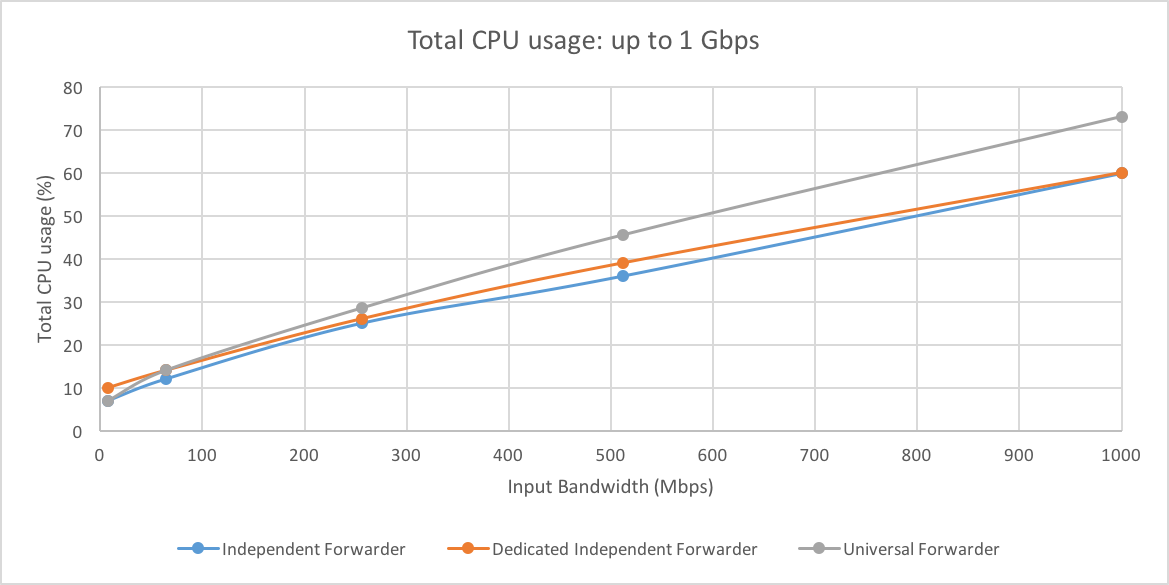
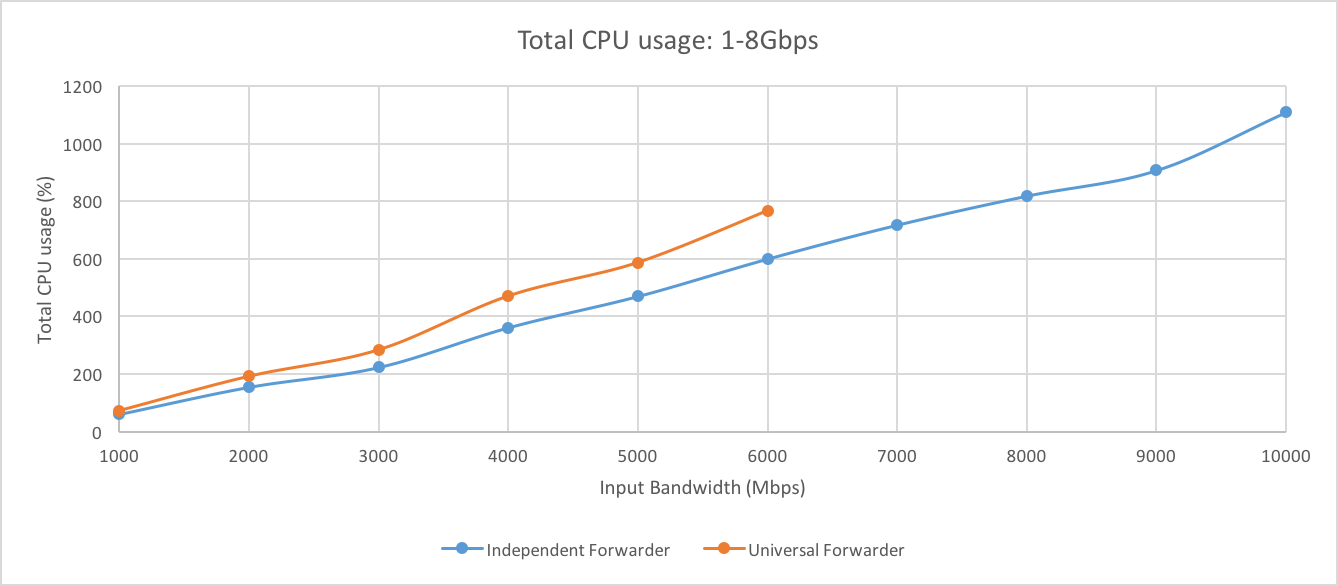
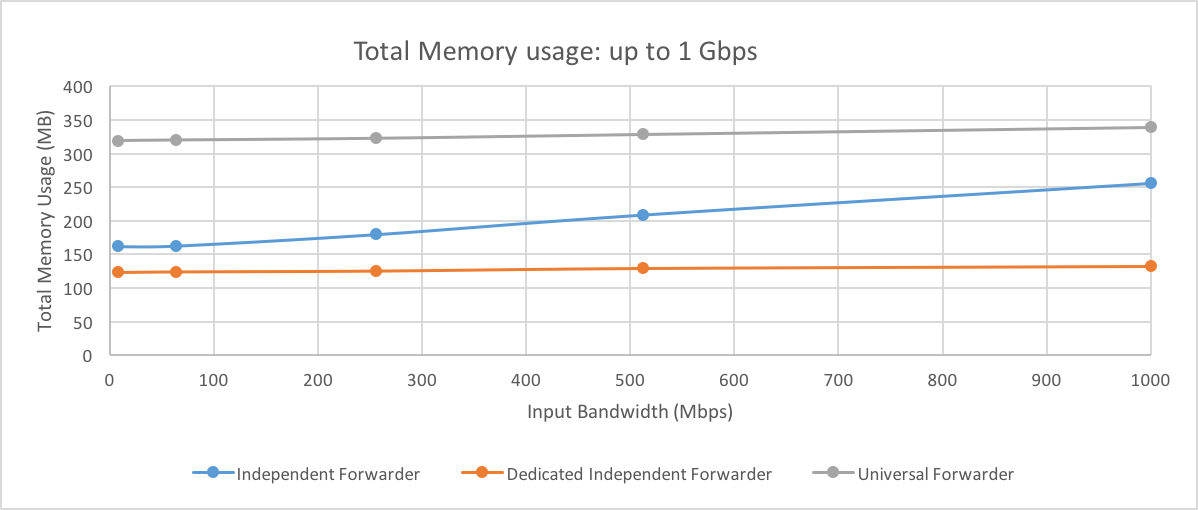
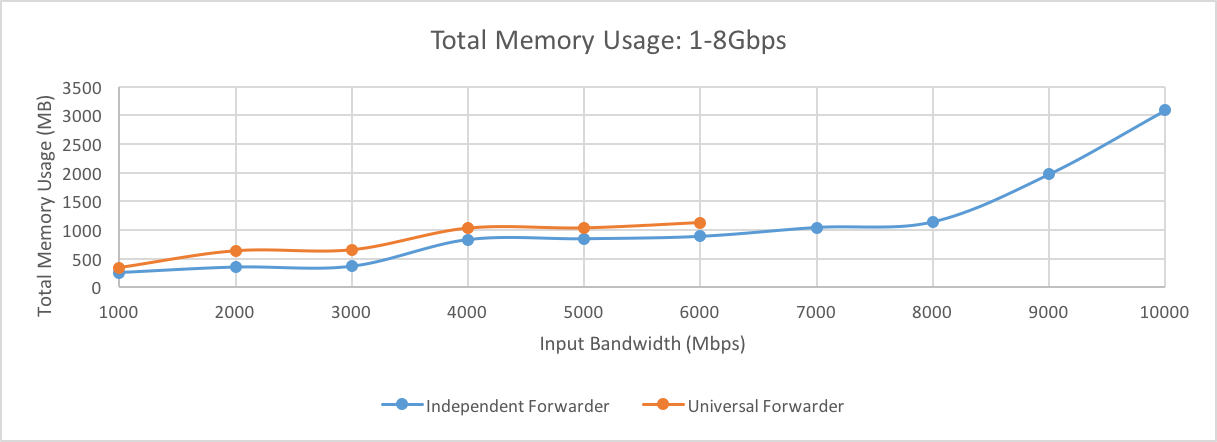
The following shows test results for Independent Stream Forwarder sending data to indexers using HTTP Event Collector. splunkd CPU usage and Memory usage statistics are not included as splunkd is not used when running streamfwd in this mode.
The test configuration is identical to the 100K TCP-only test configuration. See HTTP 100K Response (TCP-only) test.
Results for Independent Stream Forwarder test
| Stat | 8 Mbps | 64 Mbps | 256 Mbps | 512 Mbps | 1 Gbps | 2 Gbps | 3 Gbps | 4 Gbps | 5 Gbps | 6 Gbps | 7 Gbps | 8 Gbps | 9 Gbps | 10 Gbps |
|---|---|---|---|---|---|---|---|---|---|---|---|---|---|---|
| CPU% (streamfwd) | 7 | 12 | 25 | 36 | 59.9 | 154 | 223 | 361 | 470 | 600 | 718 | 819 | 908 | 1110 |
| Memory MB (streamfwd) | 162 | 163 | 180 | 209 | 256 | 351 | 366 | 831 | 846 | 889 | 1043 | 1141 | 1972 | 3088 |
| Drop Rate % | 0 | 0 | 0 | 0 | 0 | 0 | 0 | 0 | 0+ | 0.01 | 0.04 | 0.06 | 0.17 | 0.34 |
For more information, see Independent Stream Forwarder deployment in this manual.
| Network collection architectures | Stream forwarder sizing guide |
This documentation applies to the following versions of Splunk Stream™: 6.5.1
 Download manual
Feedback submitted, thanks!