Stream Admin dashboards
Splunk App for Stream (splunk_app_stream) provides a set of pre-built Admin dashboards, including
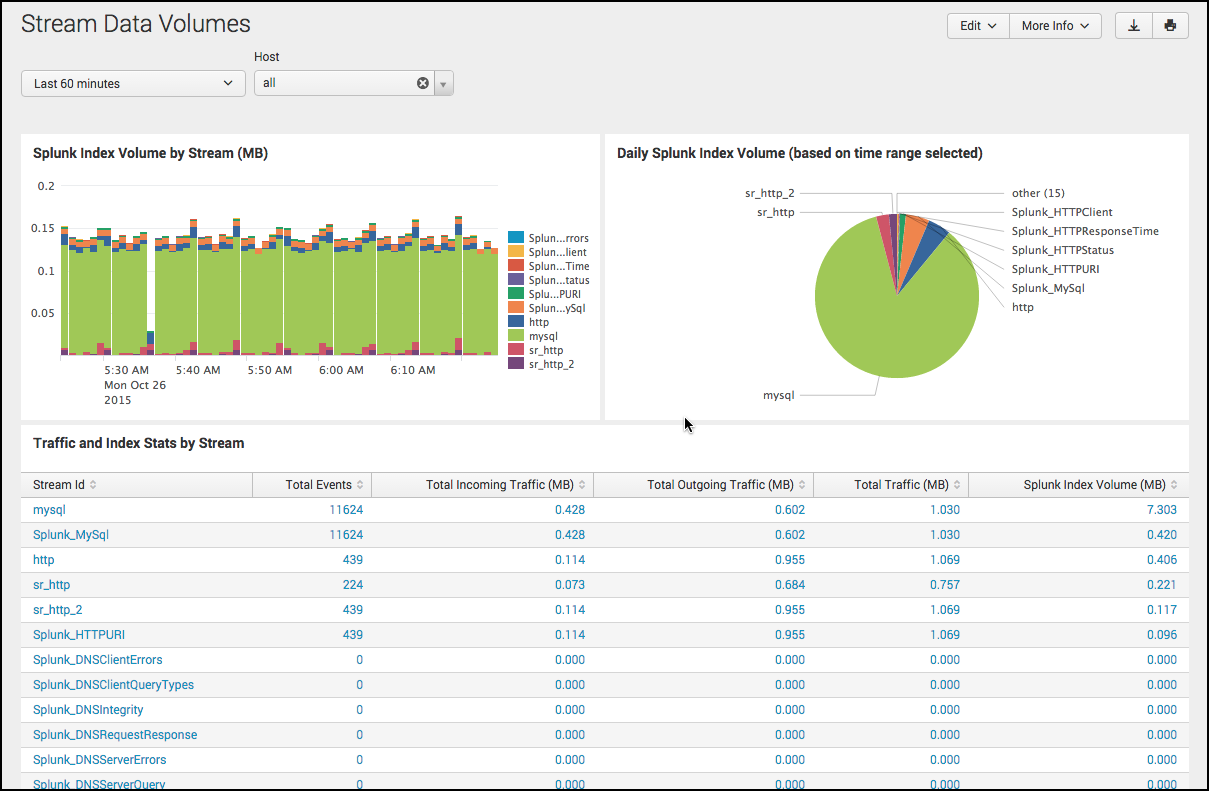
- Stream Data Volumes
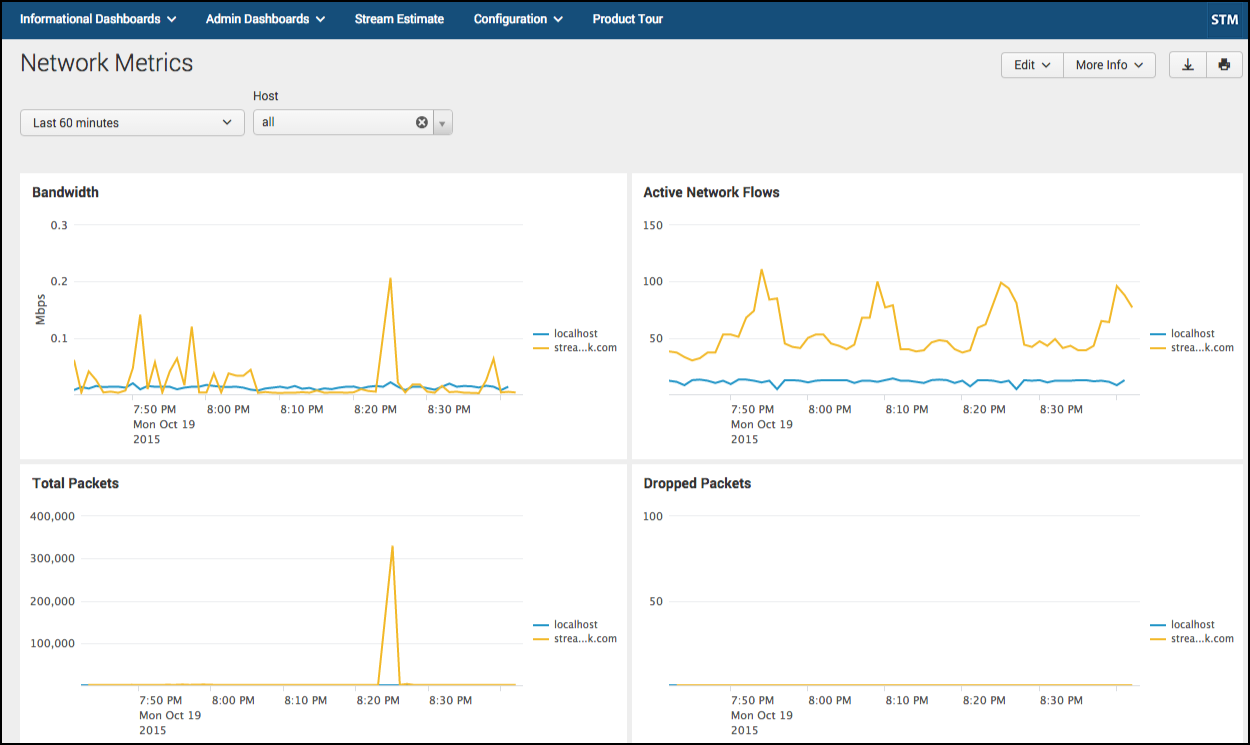
- Network Metrics
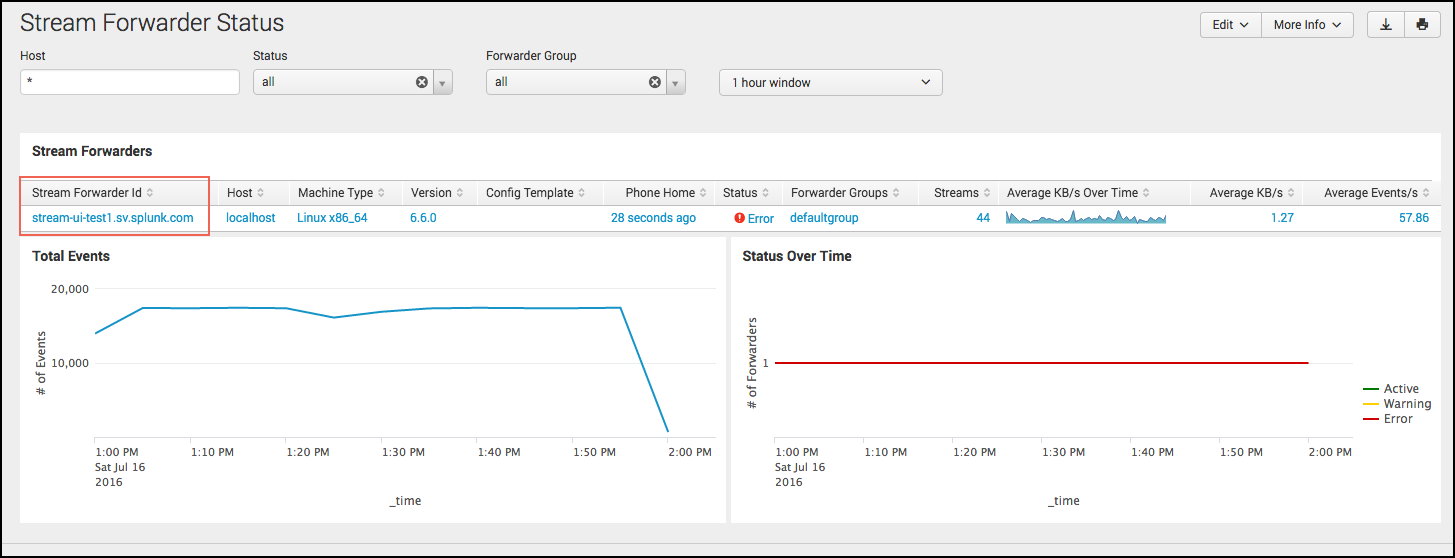
- Stream Forwarder Status
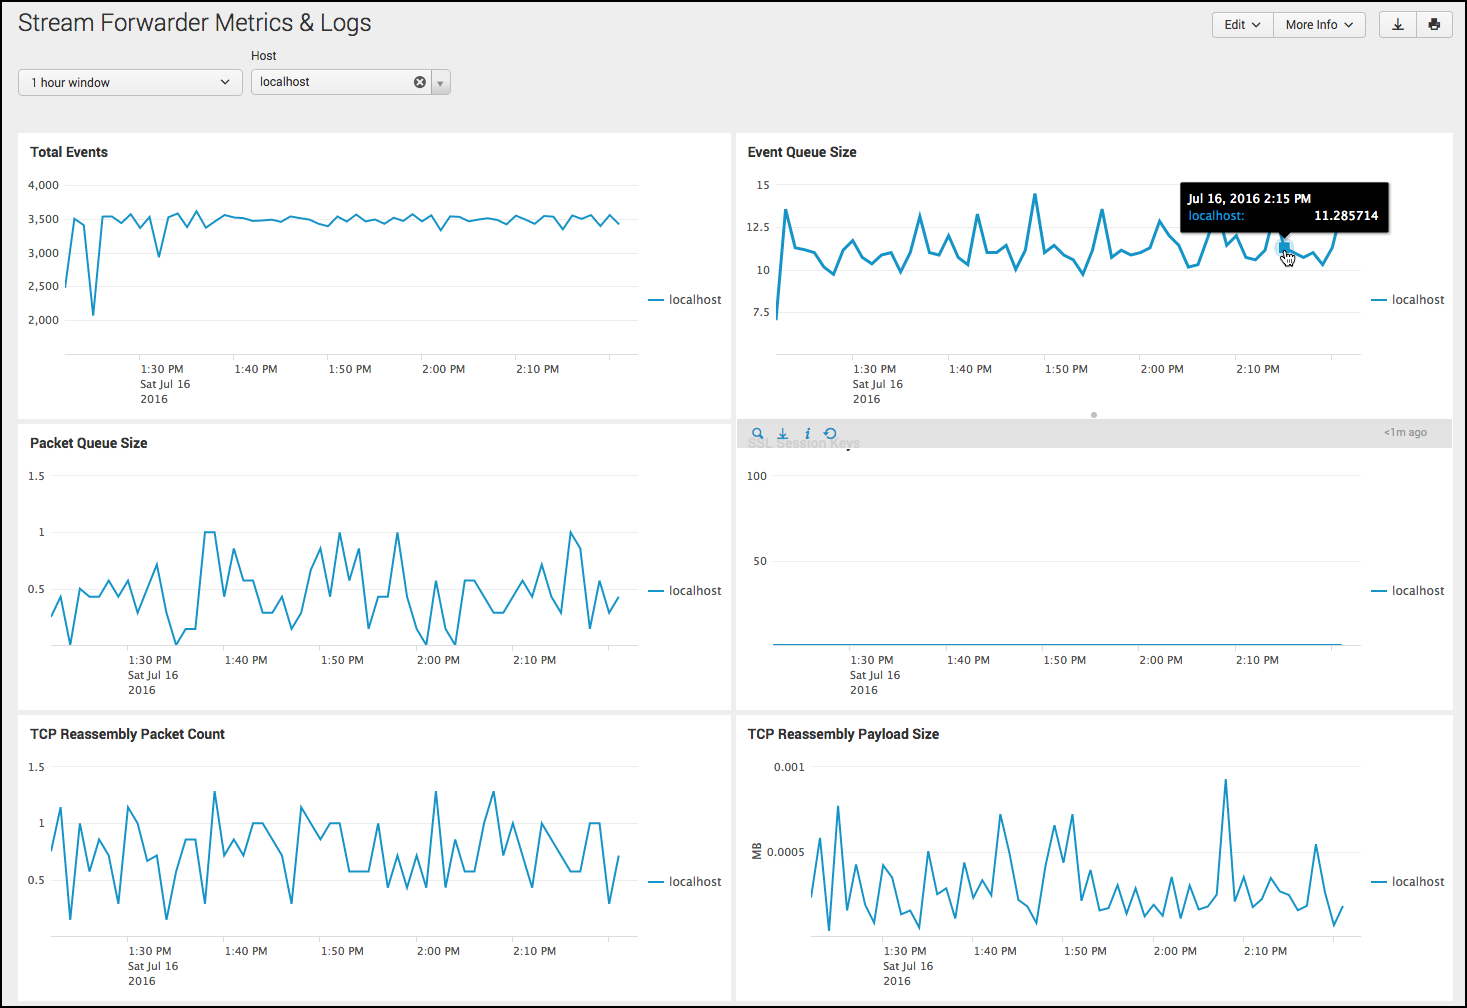
- Stream Forwarder Metrics & Logs
Use Admin dashboards to identify spikes and trends in network activity that might indicate a network issue and to analyze customer behavior. Click in any dashboard graph to drill down to Splunk search results, and perform further analysis on network, streamfwd process, and log data.
Note: Data used to populate Stream Admin dashboards is collected by Stream Forwarders and stored in the _internal index. Hence, it is critical to have the _internal index forwarded from all Stream-enabled splunk instances (i.e. running on Universal and Heavy Forwarders) to the indexers.
Stream Data Volumes
The Stream Data Volumes dashboard shows index volume stats for all streams in the Enabled mode. The dashboard lets you monitor these data index volume stats:
- Total Events
- Total Incomming Traffic (MB)
- Total Outgoing Traffic (MB)
- Total Traffic (MB)
- Spunk Index Volume (MB)
In the Splunk App for Stream main menu, select Admin Dashboards > Stream Data Volumes.
Note: To view estimates of data index volume for streams in the Estimate mode, use the Stream Estimate dashboard. For more information, see Stream Estimate in this manual.
Network Metrics
The Network Metrics dashboard lets you monitor these network events:
- Bandwidth (Mbps)
- Active Network Flows
- Total Packets
- Dropped Packets
In the Splunk App for Stream main menu, select Admin Dashboards > Network Metrics.
Stream Forwarder Status
The Stream Forwarder Status dashboard displays a list your deployed stream forwarders, along with attributes, status, and configuration details for each stream forwarder. The Stream Forwarder Status dashboard is populated by a special stream of sourcetype=stream:stats that is not user configurable and does not appear in the Configure Streams UI.
In the Splunk App for Stream main menu, select Admin Dashboards > Stream Forwarder Status.
Stream Forwarder Metrics & Logs
Click on any stream forwarder in the Stream Forwarder ID list to open the Stream Forwarder Metrics & Logs dashboard for that particular stream forwarder. This dashboard provides additional detailed information on the status and behavior of individual stream forwarders, including log entries from streamfwd.log and the following streamfwd binary metrics:
- Total Events
- Event Queue Size
- Packet Queue Size
- SSL Session Keys
- TCP Reassembly Packet Count
- TCP Reassembly Payload Size
- Event Attributes
| Stream Informational Dashboards |
This documentation applies to the following versions of Splunk Stream™: 7.0.0, 7.0.1


 Download manual
Feedback submitted, thanks!