Peer groups in Splunk UBA
For each user, user account, or device, Splunk UBA finds other entities most similar in behavior (called "peers") and groups these similar entities together using clustering methods.
You can review user peer groups to determine whether admin accounts are behavioral peers of other admin accounts. If a user account is grouped with system accounts or admin accounts, that could be a sign of credential reuse or a compromised account.
Review device peer groups to identify outliers. If a database server is grouped with several web servers, that could be a sign of a malware infection or an accurate association between a web database server with web application servers.
About peer groups
Splunk UBA tracks different types of peer groups. Peer groups update on a daily basis.
Only devices with network traffic activity and firewall-relevant data can be placed into device peer groups. Each device belongs to exactly one peer group.
Only accounts with AD activity can be placed into peer groups. Each account with AD activity belongs to exactly one behavior account peer group. Splunk UBA considers several different behavior attributes when computing peer groups, such as login and session activity and AD group membership. Some data science models use different groups to as a factor in anomaly creation and scoring. For example, the User Exfiltration and the Filer models use the organizational unit peer group.
View all device peer groups in your environment
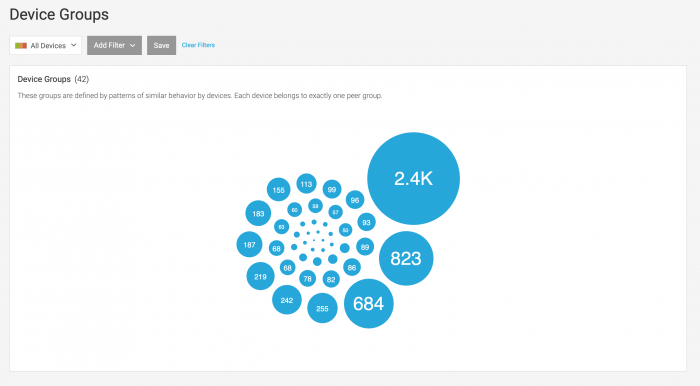
Device peer groups are defined by patterns of similar behavior by devices. Each device belongs to exactly one peer group.
To see all the device peer groups in your environment, select Explore > Devices to open the devices table, then click the Device Groups (![]() ) icon on the left menu.
) icon on the left menu.
On the Device Groups page you can view the number and size of device groups identified by Splunk UBA in your environment. Hover over a device group to learn more about why Splunk UBA grouped the devices together in that group.
Use the filters to identify which devices in a device group match a set of criteria. For example, add a filter of Anomalies Count >= 1 to identify devices involved in anomalies. Click an affected peer group to view the list of devices in the peer group.
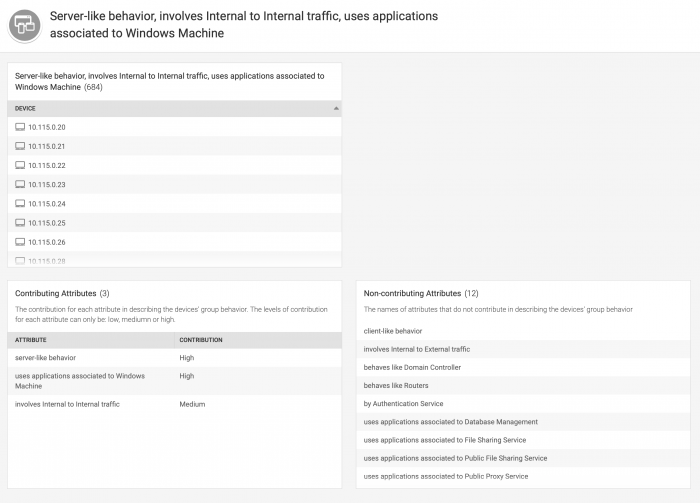
Click a device group to review the list of devices in the group, and a summary of the behaviors causing the devices to be grouped.
The name of the device group is a summary of the behaviors that caused this group to be created. In this example, the name of the group is "Server-like behavior, involves Internal to Internal traffic, uses applications associated to Windows machine." The top panel shows the list of devices that are members of this group, based on their shared behaviors.
Devices in the system are analyzed using all of the available attributes, or behaviors. Device groups are formed from any mixture of behaviors by assigning weights to each behavior on a device. If a device has a high proportion of a specific behavior, such as server-like behavior, it is assigned a higher weight for that behavior.
- View Contributing Attributes to see which attributes contributed to the device grouping, and the confidence level (weight) that Splunk UBA has in creating this grouping. In this example, the group members share a high weight for server-like behavior and use of Windows applications, and a lower weight for sharing internal traffic.
- View Non-contributing Attributes to see which attributes in the device grouping logic did not contribute to this specific device group, meaning that these behaviors were not observed in any of the devices in the group.
Splunk UBA refreshes the device peer groups weekly.
View peer groups for a user or account
View the peer groups for a user on the User Accounts page. See User Accounts. View the peer groups for an account on the Peer Groups page. See Peer Groups.
View all user and account peer groups in your environment
To see all the user and account peer groups in your environment, select Explore > Users to open the users table, then click the Peer Groups icon on the left menu.
On the peer groups page you can view the number and size of peer groups identified by Splunk UBA in your environment.
The following types of peer groups are available:
- Behavior account peer groups. These groups are defined by patterns of similar behavior by accounts. Splunk UBA identifies behavior patterns in login activity, AD events, and the sources and destinations from which accounts are accessed to determine behavior peers for accounts.
- Organizational unit peer groups. These groups are defined by the HR data added to Splunk UBA.
- AD peer groups. Defined by the AD data in Splunk UBA.
- HR peer groups. Defined by similar properties shared among user accounts.
The HR Peer Grouping Model as well as the Behavior Account Group portion of the Peer Grouping Model are both disabled in deployments of 7 or more nodes due to various system configuration adjustments required for larger deployments. As a result, no HR Peer Group or Behavior Account Group insights are visible on the User Peer Group page. This does not affect the results of any Splunk UBA detections.
Each circle represents a group, and the number represents the number of accounts within that peer group. Use the filters to learn more about the types of accounts in peer groups.
For example, you can filter on anomalous users and see which peer groups have anomalous users in them. The circles change color to reflect your filters, with the light blue filter representing the number of accounts that match the filters you select and the number changing to represent how many accounts from the peer group match the filters.
Learn more about a peer group by clicking the circle.
- If you click the circle and drill down to more information while filters are applied, you can view both the Behavior account group with all group members, as well as the Matching accounts to view the accounts in the group that match your filters from the previous page.
- Review the peer group summary to see what makes the accounts in the peer group similar. The minimum and maximum percentiles represent the range of behaviors of the accounts in the peer group. For example, a group with minimum percentile 70% and maximum percentile 80% for a given attribute indicates that the users in the peer group range in the attribute value between 70-80% compared to all other users in the organization.
- Review the peer group details to learn more about the specific behavior attributes common for this peer group.
Compare organizational peer groups with behavior account peer groups
Review the behavior account groups that the members of an organizational unit (OU) user group or AD account group are in.
- Select Explore > Users to open the user table.
- Click the Peer Groups icon to view the peer groups.
- Click OU User Groups to view the OU user groups, AD Account Groups to view the AD account groups, or HR Peer Groups to view the HR peer groups.
- Click a specific group to view the members and view the breakdown of members of the group by behavior account group.
- Click a behavior account group to compare the users in both groups with the users only in the OU or AD group but not in the behavior account group.
Comparing the members of an OU or AD group to the behavior account peer group can be valuable to identify unexpected outliers in a department. For example, if the IT organizational unit has six desktop support associates and five of them are members in the same behavior account peer group while the sixth person is in a different behavior account group, you can review the two different behavior account groups to determine why the person might be in a different peer group and identify potentially malicious behavior.
| Review overall user activity | Investigate threats as a security analyst |
This documentation applies to the following versions of Splunk® User Behavior Analytics: 5.0.0, 5.0.1, 5.0.2, 5.0.3, 5.0.4, 5.0.4.1


 Download manual
Feedback submitted, thanks!