Send Splunk UBA data to Splunk Enterprise without Splunk Enterprise Security
Send threats and anomalies from Splunk UBA to Splunk Enterprise without using Splunk Enterprise Security (ES).
Using this method does not synchronize the data between Splunk UBA and the Splunk Enterprise. You can configure Splunk UBA to send data to Splunk ES and synchronize the status of threats in Splunk UBA with their corresponding notable events in Splunk ES. See How threats and notable events are synchronized in the Send and Receive Data from the Splunk Platform manual.
Edit props.conf to define a new source type and send Splunk UBA threats and anomalies as individual events
When multiple threats and anomalies are sent from Splunk UBA to Splunk Enterprise, they are grouped together into a single event. Edit the props.conf file on your Splunk Enterprise instance to create a new source type and manually insert line breaks so that Splunk UBA threats and anomalies are sent as separate events.
For example, create a new source type named uba_threats_syslog:
[uba_threats_syslog]
DATETIME_CONFIG  = CURRENT
TRUNCATE = 100000
pulldown_type = true
LINE_BREAKER     = ([\r\n]+)(?:uba_evt_id|description)=
SHOULD_LINEMERGE = False
Configure a port and index on Splunk Enterprise
Configure a listening port and index on Splunk Enterprise.
- In Splunk Web, select Settings > Data inputs.
- Find TCP on the Data Inputs page, and select + Add new.
- Specify a TCP port number that Splunk Enterprise will use to listen for Splunk UBA data, then click Next.
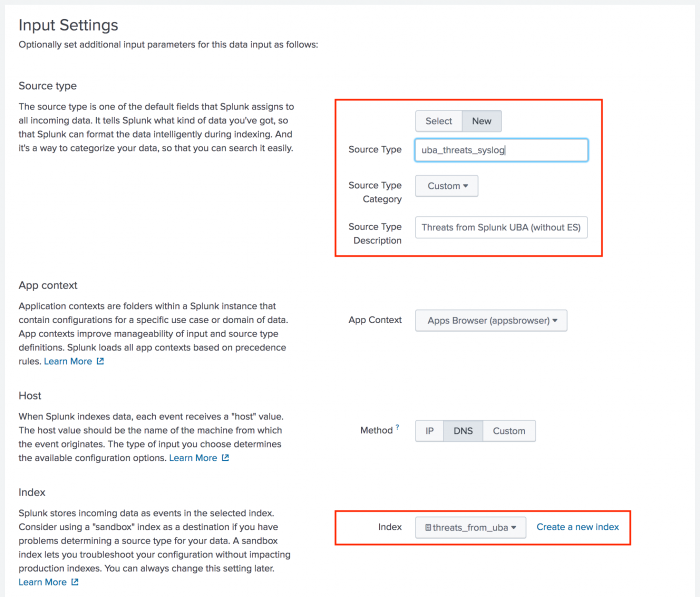
- On the Input Settings page, create a new source type and index.
- Select New in the Source Type field.
- Specify a name for the new source type, such as uba_threats_syslog used in the earlier example.
- (Optional) Enter a description for the new source type.
- In the Index field, click Create a new index.
- Specify a name for the index, then click Save.
- Click Review to review the configuration.
- Click Submit to complete the configuration.

Configure a new output connector in Splunk UBA
On Splunk UBA, add an output connector to join your Splunk UBA instance with Splunk Enterprise.
- In the
/etc/caspida/local/conf/uba-site.propertiesfile, set theuba.splunkes.integration.enabledproperty tofalse. - In distributed Splunk UBA deployments, synchronize the configuration changes across the cluster and restart Splunk UBA:
/opt/caspida/bin/Caspida sync-cluster /etc/caspida/local/conf
- Run the following commands to restart Splunk UBA:
/opt/caspida/bin/Caspida stop
/opt/caspida/bin/Caspida start
- In Splunk UBA, select Manage > Output Connectors.
- Click New Output Connector.
- Select SplunkES as the connector type, then click Next. Even though Splunk ES is not configured, Splunk UBA sends data to the specified port configured on Splunk Enterprise.
- Enter a Name for the output connector.
- The Forwarder Host is the IP address of the Splunk Enterprise search head or forwarder with the TCP data input enabled. For a search head cluster, choose a search head to integrate with Splunk UBA as Splunk UBA does not support integrating with multiple search heads.
- The Forwarder Port is the TCP port that is open for receiving data on the Splunk Enterprise search head or forwarder. Make sure this port is open behind your firewall.
- Specify the Splunk ES API URL in the following format:
https://<forwarder-host>:<mgmt-port>
Splunk UBA uses this connection to synchronize the status of its threats with notable events in Splunk ES. The management port is usually 8089. - Specify a username and password.
- Select how you want this output connector to process anomalies and threats.
Option Description Process Threats Select Process Threats to enable Splunk UBA to export threats based on any configured output connectors, such as sending email or sending threats to Splunk ES. If this is not selected, no threats are exported from Splunk UBA, even if Auto Process is selected. Process Anomalies Select Process Anomalies to enable Splunk UBA to export anomalies based on any configured output connectors, such as sending email or sending anomalies to Splunk ES. If this is not selected, no anomalies are exported from Splunk UBA, even if Auto Process is selected. Auto Process Select Auto Process to automatically forward anomalies and threats as they are created to Splunk ES. If this is not selected, you must forward each anomaly or threat individually during threat review with the Export to Splunk ES action from the Anomaly Details or Threat Details page. See Review Current Threats in Use Splunk User Behavior Analytics.
Selecting Auto Process in conjunction with Process Anomalies can cause a significant increase in traffic. Review the output connector logs to verify the health and performance of your system. See the Output Connector Service health monitor status codes. If you are monitoring Splunk UBA using the Splunk UBA Monitoring app, see About the Splunk UBA Monitoring app in theSplunk UBA Monitoring App manual.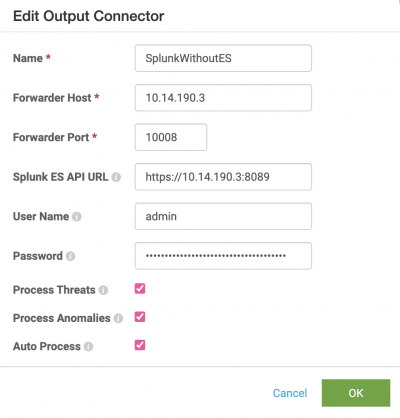
- Click OK.

If you need to edit this output connector at a later time to make changes, run the following commands to restart the output connector for the changes to take effect:
sudo service caspida-outputconnector stop
sudo service caspida-outputconnector start
Threat event fields sent from Splunk UBA to Splunk Enterprise
An example threat sent from Splunk UBA to Splunk Enterprise:
uba_evt_id="32", description=". A host on your network has been compromised and is attempting to communicate with a malicious domain or address.", uba_evt_type="Threat", action="", severity="high", signature="1406", signature_ext="Malware", threat_category="Malware", sender="10.26.32.81", link="https://10.26.32.81/#Y2FzcGlkYS50aHJlYXRzLnRocmVhdFZpZXc*eyJlbnRpdHlJZCI6IjMyIn0=", status="Active", severity_id="8", app="", url="www.byiegfs.ddns.info", url="217.67.30.192", start_time="2017-09-25 00:00:00 GMT", modify_time="2017-09-25 05:47:15 GMT", uba_time="2018-05-24 23:40:49 GMT", user="John Doe", dvc="jdoe-1111", dvc="10.20.3.4", dvc="10.20.3.6", anomaly_id="-5643037880532357419", anomaly_id="-3505498120394844405", anomaly_id="-6732514222544715096"
| Splunk UBA Token | Description |
|---|---|
| uba_evt_id | Internal ID of the threat. |
| description | Description of the threat. |
| uba_evt_type | Whether this event is a threat or anomaly. |
| action | Content of the "Whats Next" steps shown in Splunk UBA for the threat. |
| severity | Critical, Major, or Minor in Splunk UBA, which maps to High, Medium, or Low in Splunk Enterprise. |
| signature | Internal threat name. Sometimes this has a numerical value. |
| signature_ext | External Threat type. |
| threat_category | Category of the threat. |
| sender | The Splunk UBA host. |
| link | Link to the threat details. |
| status | Threat status, such as Active, ClosedBySystem, or ClosedByUser. An empty status appears when the threat was created. |
| severity_id | Numeric value of the threat score. |
| app | Applications associated with this threat. |
| url | Domains associated with this threat. |
| start_time | Detected time of the Splunk UBA threat. This is the time of the earliest anomaly. |
| modify_time | Updated time of the Splunk UBA threat. This is the time of the most recent anomaly. |
| uba_time | Time the threat was sent by Splunk UBA. |
| user | Users associated with this threat. |
| dvc | Devices associated with this threat. |
| anomaly id | List of anomaly IDs that are part of this threat. |
Anomaly event fields sent from Splunk UBA to Splunk Enterprise
An example anomaly sent from Splunk UBA to Splunk Enterprise:
uba_evt_id="4856719791116267490", short_description="Found 1 rare value(s) over a period of 14 days. Event Description [The Per-us ...].", description="Found 1 rare value(s) over a period of 14 days. *** 1. **Event Description [The Per-user audit policy table was created.]** is uncommon in this environment -- **22** occurrence(s) out of **14647853**. Most commonly observed values (up to top 3) are: * [The domain controller attempted to validate the credentials for an account.] occurs 3133647 time(s) out of 14647853 (**21.4%**) * [An account was successfully logged on.] occurs 2060825 time(s) out of 14647853 (**14.1%**) * [A Kerberos service ticket was requested.] occurs 1924862 time(s) out of 14647853 (**13.1%**)", uba_evt_type="Anomaly", anomaly_category_ext="Unusual Activity", anomaly_category="UnusualActivity", anomaly_category_ext="Internal", anomaly_category="Internal", severity="low", signature="OutOfProfileADActivity", signature_ext="Unusual Windows Security Event", sender="uba-perf110", link="https://uba-perf110/#Y2FzcGlkYS5hbm9tYWxpZXMuYW5vbWFseVZpZXc*eyJlbnRpdHlJZCI6IjQ4NTY3MTk3OTExMTYyNjc0OTAifQ==", severity_id="3", start_time="2018-05-24 00:00:00 GMT", uba_time="2018-05-25 12:04:05 GMT", event_time="", event_format_type="", raw_event="", dismissed_by_admin="false", detected_by="RareEventsModel_WindowsLogs", model_version="0.0.1", custom_fields="{\"eventId\":\"4902\",\"numOccurrences\":22,\"numUniqueDevices\":22,\"numUniqueDays\":2,\"eventName\":\"The Per-user audit policy table was created.\",\"type\":[\"UnusualEventId\"]}", supporting_evidence="{\"supportingEvidence\":[{\"columns\":[{\"field\":\"Process\",\"label\":\"Process\"},{\"field\":\"Path\",\"label\":\"Path\"},{\"field\":\"Event Description\",\"label\":\"Event Description\"},{\"field\":\"Return Code\",\"label\":\"Return Code\"},{\"field\":\"Login Type\",\"label\":\"Login Type\"},{\"field\":\"Event Time\",\"label\":\"Event Time\",\"type\":\"DateTime\"}],\"rows\":[{\"Path\":\"\",\"Return Code\":\"\",\"Login Type\":\"\",\"Event Time\":\"2018-05-24T00:00:00Z\",\"Event Description\":\"The Per-user audit policy table was created.\",\"Process\":\"\"}],\"title\":\"Anomaly Details\",\"description\":\"\",\"type\":\"Grid\"},{\"columns\":[{\"field\":\"Devices\",\"label\":\"Devices\",\"entityType\":\"Device\"}],\"rows\":[{\"Devices\":\"-1244386803515375948\"},{\"Devices\":\"-5456645641589726717\"},{\"Devices\":\"-227149578738803653\"},{\"Devices\":\"-4378141409120668699\"},{\"Devices\":\"3785815629181053078\"},{\"Devices\":\"5464118799763016996\"},{\"Devices\":\"1097029262782666968\"},{\"Devices\":\"-1089977922692721693\"},{\"Devices\":\"-3015217562199371229\"},{\"Devices\":\"4440029127420326970\"},{\"Devices\":\"3224924323665766881\"},{\"Devices\":\"-7535167144462944035\"},{\"Devices\":\"6426875824543381049\"},{\"Devices\":\"1480077471641103671\"},{\"Devices\":\"-1674221458184349996\"},{\"Devices\":\"5605561914508690127\"},{\"Devices\":\"1247436783761362624\"},{\"Devices\":\"852247130762335769\"},{\"Devices\":\"-3948864634323449999\"},{\"Devices\":\"-4896113218265713193\"},{\"Devices\":\"7638182402577223230\"},{\"Devices\":\"3983293074031141219\"}],\"title\":\"Devices That Have the Same Combination of Rare Values Over a Period of 14 Days\",\"description\":\"This table shows devices that have the same combination of rare values.\",\"type\":\"Grid\"},{\"columns\":[{\"field\":\"Days\",\"label\":\"Days\",\"type\":\"DateTime\"}],\"rows\":[{\"Days\":\"2018-05-24T00:00:00Z\"},{\"Days\":\"2018-05-23T00:00:00Z\"}],\"title\":\"Days That Have the Same Combination of Rare Values Over a Period of 14 Days\",\"description\":\"This table shows days that have the same combination of rare values.\",\"type\":\"Grid\"}]}", user="", dvc="-1674221458184349996", app="", url=""
| Splunk UBA Token | Description |
|---|---|
| uba_evt_id | Internal ID of the anomaly. |
| short_description | Short description of the anomaly. |
| description | Description of the anomaly with details. |
| uba_evt_type | Whether this event is a threat or an anomaly. |
| anomaly_category_ext | List of category names of the anomaly |
| anomaly_category | List of category names of the anomaly. This sometimes has numeric values. |
| severity | Critical, Major, or Minor in Splunk UBA, which maps to High, Medium, or Low in Splunk Enterprise. |
| signature | Internal name of the anomaly. |
| signature_ext | External name for the anomaly. |
| sender | Splunk UBA host that sent the anomaly. |
| link | Link to the anomaly details. |
| severity_id | Numerical value of the score. |
| start_time | Time that the anomalous event started. |
| uba_time | Time the anomaly was sent by Splunk UBA. |
| event_time | Duration of the anomaly. |
| event_format_type | Format of the raw event, if raw event is present. |
| dismissed_by_admin | Field is not used. |
| raw_event | Raw event that caused that anomaly. |
| detected_by | Name of the Splunk UBA model that detected the anomaly. |
| model_version | Version number of the Splunk UBA model that detected the anomaly. |
| custom_fields | Anomaly metadata in JSON format. |
| supporting_evidence | JSON which contains UBA visualization for the anomaly. |
| user | Users associated with the anomaly. |
| dvc | Devices associated with the anomaly. |
| app | Applications associated with the anomaly. |
| url | Domains associated with the anomaly. |
The custom_fields and supporting_evidence fields require modifications to the props.conf file in order to be parsed correctly.
Send a threat from Splunk UBA to Splunk Enterprise
Send an individual threat from Splunk UBA to Splunk Enterprise.
- From the threat details page, click Actions, then select Export to SplunkES. Even though Splunk ES is not configured, Splunk UBA will send the data to the port configured as the SplunkES output connector.
- In Splunk Enterprise, run a search using the port number specified in Configure a port and index on Splunk Enterprise. For example:
source="tcp:10008"
| Send Splunk UBA data to Splunk Enterprise Security | Send Splunk UBA threats to analysts using email |
This documentation applies to the following versions of Splunk® User Behavior Analytics: 5.0.0, 5.0.1, 5.0.2, 5.0.3, 5.0.4, 5.0.4.1, 5.0.5, 5.0.5.1, 5.1.0, 5.1.0.1, 5.2.0, 5.2.1, 5.3.0
Feedback submitted, thanks!