How Splunk UBA sends and receives data from the Splunk platform
Splunk User Behavior Analytics (UBA) can send data to and receive data from the Splunk platform in a variety of ways, as shown in the following figure.

The following table provides additional details about each type of integration between Splunk UBA and Splunk Enterprise Security (ES) and Splunk Enterprise.
| Integration | Configuration | How to Secure | Splunk Add-on for Splunk UBA Required? | Documentation |
|---|---|---|---|---|
| Splunk UBA pushes anomalies and threats to Splunk ES as notable events. Splunk UBA anomalies and threats are stored in Splunk ES as notable events. | Configure the SplunkES output connector in Splunk UBA and connect to port 10008 on the Splunk ES search head. | TLS (store the Splunk root CA certificate in Splunk UBA) | Yes | Send Splunk UBA anomalies and threats to Splunk ES as notable events. |
| Splunk UBA pulls notable events from Splunk ES and stores them in Splunk UBA as External Alarms. | Configure a data source connector in Splunk UBA and connect to the search head or forwarder port 8089 on Splunk ES. | TLS (store the Splunk root CA certificate in Splunk UBA) | Yes | Pull notable events from Splunk ES to Splunk UBA. |
| Splunk UBA pushes health logs to Splunk Enterprise. Use the Splunk UBA Monitoring App to monitor the health of your Splunk UBA deployment from Splunk Enterprise. | Enable the forwarder embedded in Splunk UBA to forward health logs to the _internal index on port 9997. You can customize the index and port number as needed.
|
TLS (the usual ways to secure forwarder-to-indexer communications) | No | About the Splunk UBA Monitoring app in the Splunk UBA Monitoring App manual. |
| Splunk UBA pushes audit data to Splunk Enterprise for analysis. | Configure the property in the uba-site.properties file in Splunk UBA to send audit events to Splunk search head or forwarder port 10008. Events are sent to the _audit index on Splunk Enterprise.
|
TLS (store the Splunk root CA certificate in Splunk UBA) | Yes | Send Splunk UBA audit events to Splunk ES. |
| Splunk Enterprise pushes events directly to Kafka on Splunk UBA. | Splunk UBA issues micro batch queries to the REST API on the Splunk search head on port 8089. The indexers then push the search results back to Kafka on Splunk UBA (port 9093). | TLS (store the Splunk root CA certificate in Splunk UBA) | No | Send data from the Splunk Platform directly to Kafka in the Splunk UBA Kafka Ingestion App manual. |
| Splunk UBA pulls raw events from Splunk Enterprise. | Configure a Splunk connector in Splunk UBA and connect to a Splunk search head on port 8089. | TLS (secure access to Splunk's REST API) | No | Use connectors to add data from the Splunk platform to Splunk UBA in the Get Data into Splunk User Behavior Analytics manual. |
| Use Event Drilldown in Splunk UBA to view raw events in the Splunk platform. | No data is passed. Clicking on the link takes you to Splunk Enterprise, where the raw events query is run. Splunk web (8000/443) and management ports (8089). | TLS (secure access to Splunk's REST API) | No | Use event drilldown to review an anomaly's raw events in Use Splunk User Behavior Analytics. |
Configure the OutputConnector to add a unique user identifier to Enterprise Security
Perform the following optional steps to configure the OutputConnector to add the employeeid field as a unique user identifier to Splunk Enterprise Security (ES):
- In the UBA management node as the caspida user, set the uba.splunkes.threat.export.json parameter to "true" in /etc/caspida/local/conf/uba-site.properties as shown in the following example:
uba.splunkes.threat.export.json=true - Make a copy of uba_threat_export.json file as shown in the following example:
cp -p /opt/caspida/conf/export/splunkes/uba_threat_export.json /opt/caspida/conf/export/splunkes/uba_threat_export.json.ORIG - Edit /opt/caspida/conf/export/splunkes/uba_threat_export.json, and add the following
employeeidfield under entityInfo > user > fields:{ "name": "employeeid", "exportName": "employee_id" }Example:
"entityInfo": { "user": { "exportName": "users", "fields": [{ "name": "id", "exportName": "id" }, { "name": "employeeid", "exportName": "employee_id" }, { "name": "name", "exportName": "name" }, { "name": "type", "exportName": "type" }, { "name": "status", "exportName": "status" }, { "name": "score", "exportName": "score" }, { "name": "eventtime", "exportName": "found_time" }] }, - To sync the cluster and restart caspida services, run the following commands:
/opt/caspida/bin/Caspida sync-cluster /opt/caspida/conf/export/
/opt/caspida/bin/Caspida sync-cluster /etc/caspida/local/conf
/opt/caspida/bin/Caspida stop
/opt/caspida/bin/Caspida start
Perform the following steps in Enterprise Security (ES) to have the new employeeid field appear in Incidents Review:
- Edit the SPL corresponding to the UBA/UEBA Threat Notable and add the following fields:
| spath "entities.users{}.employee_id"
Under stats:
values(entities.users{}.employee_id) as employee_id
Example:| from datamodel:"UEBA"."UEBA_Threats" | search uba_threat_status != *closed* | spath "entities.users{}.employee_id" | stats values(employee_id) as employee_id, values(app) as app,values(dvc) as dvc,values(user) as user,dc(user) as user_count,values(url) as url,latest(action) as action,latest(uba_event_type) as uba_event_type,latest(description) as description,latest(link) as link,latest(modify_time) as modify_time,latest(severity) as severity,latest(signature) as signature,latest(start_time) as start_time,latest(threat_category) as threat_category by uba_host,uba_event_id - Modify the Incident Review Settings to add
employee_id, Employee ID in Table Attributes as shown: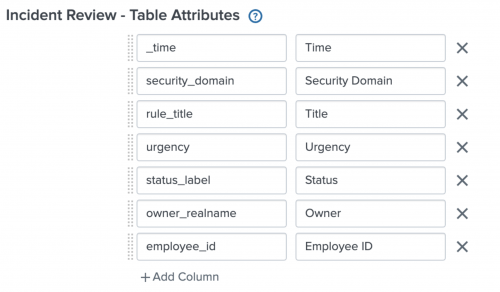
- In UBA, export threat from UBA to ES
- In ES, verify that the threat in ES shows the new
employeeidfield - In UBA, the /var/log/caspida/outoutconnector.log will show events sent that include more information.
- Changes should now be in effect as follows:
Before:user="Rod Simmers"
After:entities":"users":"id":"998811947371393516","name":"Rod Simmers","employee_id":"ACME-485",

For UBA versions 5.0.5.1 and lower, you must back up modifications to uba_threat_export.json prior to upgrading UBA as these modifications get overwritten by the upgrade process. See the following pre and post UBA upgrade details.
Pre-upgrade of UBA: Back up modified uba_threat_export.json
cp -p /opt/caspida/conf/export/splunkes/uba_threat_export.json /opt/caspida/conf/export/splunkes/uba_threat_export.json.NEW
Post-upgrade of UBA: Restore modified uba_threat_export.json
cat /opt/caspida/conf/export/splunkes/uba_threat_export.json.NEW > /opt/caspida/conf/export/splunkes/uba_threat_export.json
| About the Splunk Add-on for Splunk UBA |
This documentation applies to the following versions of Splunk® User Behavior Analytics: 5.0.0, 5.0.1, 5.0.2, 5.0.3, 5.0.4, 5.0.4.1, 5.0.5, 5.0.5.1
Feedback submitted, thanks!