Get started on the Splunk UBA home page
To begin using Splunk User Behavior Analytics (UBA), login to the Splunk UBA web interface on the management server in your deployment.
Log in to the Splunk UBA web interface
In a supported web browser, type in the IP address or host name of your Splunk UBA management server to access the Splunk UBA Web interface. If you are logging in for the first time, use the default Splunk UBA credentials of admin for the username and changeme as the password. After you log in, perform the tasks in Secure the default account after installing Splunk UBA in Install and Upgrade Splunk User Behavior Analytics.
The IP address you specify may differ slightly depending on your operating system environment. For example, in Linux environments, you specify the IP address of the Splunk UBA management server, but for VMware or Amazon Web Services (AWS) environments, you specify the public IP address to access Splunk UBA. See the end of the installation instructions for your specific environment in Install Splunk User Behavior Analytics in Install and Upgrade Splunk User Behavior Analytics.
Start using Splunk UBA on the Splunk UBA home page
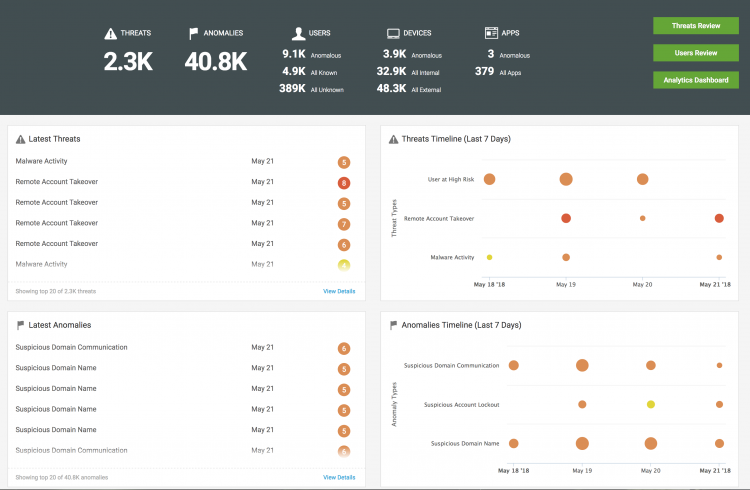
After you log in to Splunk User Behavior Analytics, you see the home page. Review the key indicators and panels to get an overview of the current security posture in your environment.
Review key indicators
The following key indicators are available at the top of the home page:
- Threats - Summarizes the total number of active threats in your environment
- Anomalies - Summarizes the total number of anomalies in your environment
- Users - Summarizes the total number of anomalous, known, and unknown users
- Devices - Summarizes the total number of anomalous, internal, and external devices
- Apps - Summarizes the total number of anomalous apps compared with the number of total apps.
Start investigative workflows
Using the green buttons on the right side of the home page, you can start several investigative workflows:
- Click Threats Review to start investigating threats. See Investigate threats as a security analyst.
- Click Users Review to review current user activity. See Review current user activity.
- Click Analytics Dashboard to review recent login activity and data transfer patterns.
Review dashboard panels
Get an overview of recent suspicious activity by reviewing the dashboard panels.
- Review the Latest Threats panel to see the most recent threats facing your organization. Click View Details to open the threats table and view all threats.
- Track threats on the 7-Day Threats Timeline to identify recent trends in threat activity.
- Review the Latest Anomalies panel to see the most recent anomalies identified in your organization. Click View Details to open the anomalies table and view all anomalies. See Review anomalies on the anomalies table.
- Identify recent anomalies on the 7-Day Anomalies Timeline.
- Make sure that event processing is flowing as expected with the Events Processing panel. Click the number of events to review the Events dashboard.
- Review the 7-Day Events Trend to identify any unexpected changes in event processing.
Filter the scope of anomalies and threats
Click Scope on the menu bar to filter the anomalies and threats that are displayed in Splunk UBA. By default, anomalies and threats for all time are displayed. You can select one of the options to view anomalies and threats for a specific period of time. Any Date is used as the default.
Entity scoring for users, devices, and apps is affected by adjusting this filter. Entity scoring occurs automatically on a daily basis.
| Scope Selected in Splunk UBA | How the Scope Affects Entity Scoring |
|---|---|
| Any Date (Default) | Entity scoring is based on anomalies and threats from the past 2 months. This window of time can be customized by adjusting the entity.score.lookbackWindowMonths property in the /etc/caspida/local/conf/uba-site.properties file.
|
| Last 12 Months | Entity scoring is based on anomalies and threats from the past 2 months. This window of time can be customized by adjusting the entity.score.lookbackWindowMonths property in the /etc/caspida/local/conf/uba-site.properties file.
|
| Last 30 Days | Entity scoring is based on anomalies and threats from the past 30 days. |
| Last 7 Days | Entity scoring is based on anomalies and threats from the past 7 days. |
Entity scoring occurs in real time when new anomalies are raised, or when existing anomalies are placed in the trash, permanently deleted, or restored.
Some anomaly actions can cause real-time entity scoring adjustments and it may take up to 24 hours before the updated scores are reflected in Splunk UBA.
| Change user profile settings in Splunk UBA |
This documentation applies to the following versions of Splunk® User Behavior Analytics: 5.0.0, 5.0.1, 5.0.2, 5.0.3, 5.0.4, 5.0.4.1, 5.0.5, 5.0.5.1

 Download manual
Feedback submitted, thanks!