Create a custom dashboard
In addition to the dashboards built in to Splunk UBA, you can create custom dashboards with panels specific to your data and network.
Follow these steps to create a custom dashboard:
- From the Splunk UBA navigation menu select Analytics > Custom Dashboards.
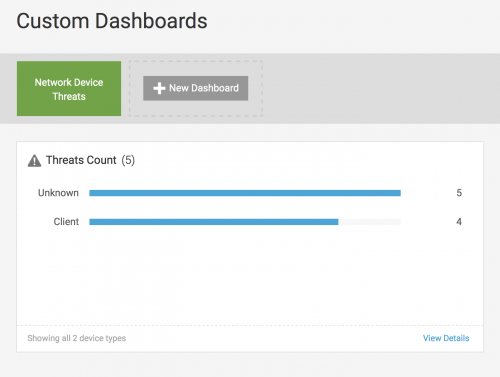
- Select New Dashboard to give a name to your custom dashboard. For example, Network DeviceThreats.
- Select New Widget to add a dashboard panel.
- Enter a Widget Name. For example, Threats Count.
- Select a Widget Measure. For example, Threats Count to see a count of threats.
- Select Next.
- Select a widget grouping. For example, Device Types.
- Select Next.
- Select appropriate filters. For example, select Threat Categories and External to see only external threats.
- Check to see how many threats match the filters you select to make sure your widget displays data.
- Select Next.
- Select a visualization.
For example, select a Bar Chart because it shows a helpful breakdown of threats by device type. The types of charts available for you to select depends on the data type. - Select OK to save your new panel.

Modify a dashboard widget
After you create a dashboard widget, you can modify it. Complete the following steps:
- Hover over the chart and gear (
 ) icon in the upper right corner of the panel.
 - Click the pencil icon to Edit Widget.
- Navigate through the widget screen to make the desired changes.
- Click OK when you are done to save your changes.
Modify a custom dashboard
You can also modify dashboards. Complete the following steps:
- Click New Dashboard to create a new custom dashboard.
- Select Actions > Delete Dashboard to remove a custom dashboard.
- Select Actions > Rename Dashboard to rename the dashboard.
Last modified on 06 December, 2023
| Customize a table view in Splunk UBA | Investigate Splunk UBA entities using Watchlists |
This documentation applies to the following versions of Splunk® User Behavior Analytics: 5.1.0, 5.1.0.1, 5.2.0, 5.2.1, 5.3.0, 5.4.0, 5.4.1, 5.4.1.1, 5.4.2, 5.4.3
Feedback submitted, thanks!