Validate data availability
After data is loaded into Splunk UBA, use the Data Availability page to validate or troubleshoot your data ingestion and identify missing data sources that enable Splunk UBA use cases, such as an expected anomaly not being triggered. Data availability shows the relationships and mappings among the following areas in Splunk UBA:
- Anomaly types
- Anomaly categories
- Threat types
- Models
- Data Views
- Data Sources
Access and use the Data Availability page in Splunk UBA
To access the Data Availability page, select System > Data Availability in Splunk UBA.
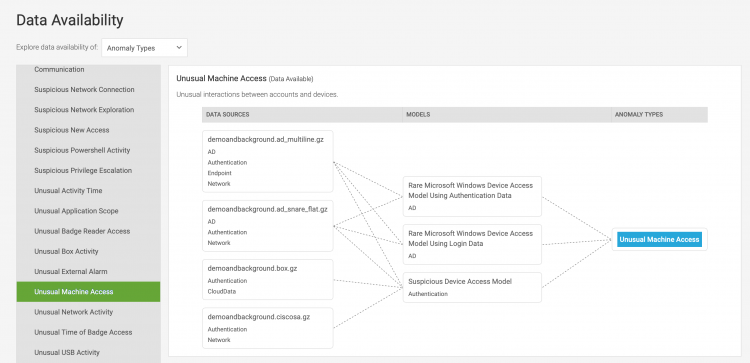
Click on a content type in the Data Available section, which is at the top of the left column. In this example, the Unusual Machine Access anomaly is selected, and the page shows the data sources and threat model used to generate this anomaly. The box containing the anomaly name has a dark blue background indicating that all expected data sources are accounted for and the use case is operational.
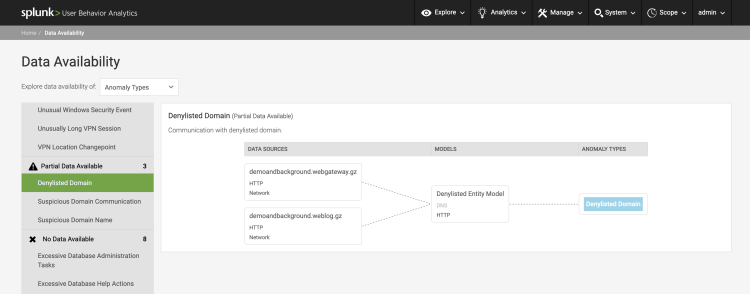
If Splunk UBA detects that not all data sources are available, the anomaly appears in the Partial Data Available section in the left column.
In this example, the Denylisted Entity Model takes data to generate Denylisted Domain anomalies. Two data sources are already providing HTTP data to the model. However, the model also expects a DNS data source which is not present. The light gray DNS in the Models box indicates that the data source is missing or incomplete, and the box containing the anomaly name is light blue instead of a darker shade of blue.
If no data is available, the anomaly appears in the No Data Available section. The box containing the anomaly name has no color, indicating that none of the expected data sources are present.
Verify the total number of models in Splunk UBA
Select Models from the drop-down list on the Data Availability page to view all threat models available in Splunk UBA.
You can also view the models on the Models page by selecting System > Models from the Splunk UBA menu bar. Click on Streaming Models or Batch Models to view the models. Note that the models on the Models page also includes task models which are not included on the Data Availability page. Thus, the total number of models shown on the Models page will not match the total number of models shown on the Data Availability page.
| Review and edit existing data sources in Splunk UBA |
This documentation applies to the following versions of Splunk® User Behavior Analytics: 5.2.0, 5.2.1, 5.3.0, 5.4.0, 5.4.1, 5.4.1.1, 5.4.2


 Download manual
Feedback submitted, thanks!