Scaling your Splunk UBA deployment
Install Splunk User Behavior Analytics (UBA) in a single-server or distributed deployment architecture. A distributed deployment helps you scale your Splunk UBA installation horizontally with streaming and batch servers.
The nodes in a distributed Splunk UBA deployment perform a high number of computations among them and require fast network connections. For this reason, do not deploy Splunk UBA across different geographical locations. If you have multiple sites, configure a duplicate Splunk UBA cluster as a warm standby system. See Configure warm standby in Splunk UBA in the Administer Splunk User Behavior Analytics manual.
What size cluster do I need?
Use the parameters below to guide you in properly sizing your Splunk UBA deployment. Exceeding the limits will have a negative impact on performance and can result in events being dropped and not processed.
- The Max events per second capacity represents the peak events rate processed by Splunk UBA when ingesting data from Splunk Enterprise.
- The Max Number of accounts represents the total number of accounts monitored by Splunk UBA, such as user, admin, system, or service accounts.
- The Max Number of devices represents the total number of devices monitored by Splunk UBA.
- The Max number of data sources represents the total number of data source connectors configured on Splunk UBA to ingest data from Splunk Enterprise.
| Size of cluster | Max events per second capacity | Max Number of accounts | Max Number of devices | Max number of data sources |
|---|---|---|---|---|
| 1 Node | 4K | up to 50K | up to 100K | 6 |
| 3 Nodes | 12K | up to 50K | up to 200K | 10 |
| 5 Nodes | 20K | up to 200K | up to 300K | 12 |
| 7 Nodes | 28K | up to 350K | up to 500K | 24 |
| 10 Nodes | 40K-45K | up to 350K | up to 500K | 32 |
| 20 Nodes - Classic | 75K-80K | up to 750K | up to 1 Million | 64 |
| 20 Nodes - XL | 160K | up to 750K | up to 1 Million | 64 |
Engage Splunk engineering if the requirements for your environment exceed the limits listed in the table above. You can use the backup and restore scripts to migrate from your current deployment to the next larger deployment. See Migrate Splunk UBA using the backup and restore scripts in the Administer Splunk User Behavior Analytics manual.
After Splunk UBA is operational, you must perform regular maintenance of your Splunk UBA deployment by managing the number of threats and anomalies in your system. See Manage the number of threats and anomalies in your environment for information about the maximum number of threats and anomalies that should be in your system based on your deployment size.
About the 20 Node XL option
A new 20 node option is available with version 5.3.0 and higher of Splunk UBA. The 20 Node XL option is a vertically scaled-up version of the current 20 Node "Classic" option. The 20 Node XL option increases events-per-second (EPS) support up to 160K events.
The 20 Node XL system is only available for 20 node deployments.
20 Node XL offers the following features:
- Supports up to 160K EPS, 750K accounts, and 1M devices
- Offers additional Kubernetes containers that increase throughput
- Increased Stream Model memory limits in support of large volumes of data
- Increased number and size of Kafka partitions
- Increased memory allocation to Spark
- Increased resource allocation to Impala and Postgres to handle higher volumes of data
20 Node XL requirements
The following is required to successfully use the 20 Node XL option:
| Component | Requirement |
|---|---|
| Cluster | Cluster must be running with 20 nodes |
| Nodes | All 20 nodes need 32 cores of CPU and 128GB RAM |
| Disk 1 | Disk 1 needs 100GB of storage |
| Disk 2 |
|
| Disk 3 | Node-17-20: 2TB of storage |
Use 20 Node XL on a fresh Splunk UBA installation
To use the 20 Node XL option, first install Splunk UBA ensuring your system meets the 20 Node XL requirements. After Splunk UBA is deployed, run the following command to activate and apply the XL files:
/opt/caspida/bin/Caspida stop-all
/opt/caspida/bin/Caspida tune-configuration-cluster "xl"
/opt/caspida/bin/Caspida remove-containerization
/opt/caspida/bin/Caspida setup-containerization
/opt/caspida/bin/Caspida start-all
Use 20 Node XL on a Splunk UBA upgrade
If you are a current UBA user perform the following steps to implement the 20 Node XL option:
- Upgrade your current UBA 20-node cluster to version 5.3.0 and make sure it is operational before turning on the 20 Node XL option.
- Stop UBA:
/opt/caspida/bin/Caspida stop-all
- Shutdown nodes and increase hardware as needed.
- Restart nodes.
For Hadoop Datanodes, expand your
/var/vcapvolumes to fill the new disks - Run the following command to activate and apply the XL files:
/opt/caspida/bin/Caspida tune-configuration-cluster "xl"
/opt/caspida/bin/Caspida remove-containerization
/opt/caspida/bin/Caspida setup-containerization
/opt/caspida/bin/Caspida start-all
Use 20 Node XL on a Splunk UBA upgrade - AWS users
The 20 Node XL option is only supported for the following AWS instance types:
- m5a.8xlarge
- m5.8xlarge
- m6a.8xlarge
- m6i.8xlarge
If you need to change your instance type, be aware that AWS has some limitations when it comes to changing instance types. For example, you cannot change from an m5 to m6 instance, but you can change from one type of m6 instance to another. Such as m6i.4xlarge to m6i.8xlarge.
If you are using a supported AWS instance type, perform the following steps to implement the 20 Node XL option:
- Upgrade your current UBA 20-node cluster to version 5.3.0 and make sure it is operational before turning on the 20 Node XL option.
- Stop UBA:
/opt/caspida/bin/Caspida stop-all
- Shutdown nodes and migrate to one of the following instance types: m5a.8xlarge, m5.8xlarge, m6a.8xlarge, or m6i.8xlarge.
- Restart nodes.
For Hadoop Datanodes, expand your
/var/vcapvolumes to fill the new disks - Run the following command to activate and apply the XL files:
/opt/caspida/bin/Caspida tune-configuration-cluster "xl"
/opt/caspida/bin/Caspida remove-containerization
/opt/caspida/bin/Caspida setup-containerization
/opt/caspida/bin/Caspida start-all
Revert back from 20 Node XL to 20 Node Classic
Under rare circumstances you might need to fall back to the Classic option. Run the following command to revert back to the 20 Node Classic system:
If you opt to fall back to 20 Node Classic, you can scale back CPU and RAM sizes, but not the disk storage size. Scaling back disk storage size might cause data loss.
/opt/caspida/bin/Caspida stop
/opt/caspida/bin/Caspida cleanup-kafka-topics
/opt/caspida/bin/Caspida stop-all
/opt/caspida/bin/Caspida tune-configuration-cluster
/opt/caspida/bin/Caspida remove-containerization
/opt/caspida/bin/Caspida setup-containerization
/opt/caspida/bin/Caspida start-all
Example: Sizing a Splunk UBA deployment
The following example shows how to determine the proper deployment for a particular environment:
When performing this action in your own instance, consider identifying your key indexes first, and only running the tstats query on those indexes.
- Use the following
tstatsquery on Splunk Enterprise. This query obtains the EPS statistics for the last 30 days.| tstats count as eps where index=* earliest=-30d@d groupby index, sourcetype _time span=1s | stats count as NumSeconds max(eps) perc99(eps) perc90(eps) avg(eps) as avg_eps by index, sourcetype | addinfo | eval PercentageOfTimeWithData = NumSeconds / (info_max_time - info_min_time) | fields - NumSeconds info* | eval EffectiveAverage = avg_eps * PercentageOfTimeWithData | fieldformat PercentageOfTimeWithData = round(PercentageOfTimeWithData*100,2) . "%" - Export the results to a CSV file. See Export search results in the Splunk Enterprise Search Manual for options and instructions.
- Using a spreadsheet program such as Microsoft Excel, open the CSV file and remove all rows that have data sources that will not be ingested into Splunk UBA. See Which data sources do I need? in the Get Data into Splunk User Behavior Analytics manual to determine the data sources you need to configure. The data sources you need will vary depending on your environment and the content you want to see in Splunk UBA.
- Get a total of the EPS in the 99% and 90% columns. Base your sizing requirements on the 99% column to get the added benefit of providing a cushion of extra nodes.
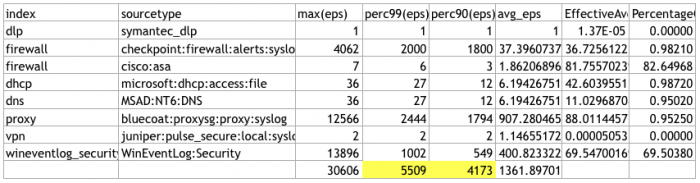

This example has a total EPS in the 99% column over 5,000 and fewer than 10 data sources, meaning that a 3-node deployment is sufficient.
Best practices for optimizing Splunk UBA performance
Splunk UBA performance can vary depending on the number and size of your data sources, indexer and CPU usage, and network throughput. Perform the following to help Splunk UBA run in a more efficient manner:
- Split heavy data sources into smaller data sources
- Calculate potential bandwidth requirements at the TCP level
- Check the load on your Splunk platform indexers
Split heavy data sources into smaller data sources
Each data source in Splunk UBA requires its own TCP connection with the Splunk platform. Splunk UBA performs and scales more efficiently with multiple parallel TCP connections, as opposed to a single large connection. Smaller data sources can help you avoid having any lag during data ingestion. Work with your professional services team to determine the best way to split your data sources.
Calculate potential bandwidth requirements at the TCP level
Use the following formula to determine the minimum bandwidth required for each TCP connection. For example, to calculate the bandwith required to achieve 40K events per second:
Average event size (bytes) * 40K / Number of data sources * 8 / 1024 / 1024
For example, using 410 bytes as the average event size, with 27 data sources, we need 4.6 Mbits per second for each TCP connection:
410 * 40,000 / 27 * 8 / 1024 / 1024 = 4.6 Mbits
Check the load on your Splunk platform indexers
Overloaded indexers on your Splunk platform can cause delays in your data ingestion, or even cause events to be dropped.
See Identify and triage indexing performance problems in the Splunk Enterprise Troubleshooting Manual to begin to troubleshoot indexing performance problems in Splunk software.
| Splunk UBA deployment architecture | Splunk UBA product compatibility matrix |
This documentation applies to the following versions of Splunk® User Behavior Analytics: 5.4.0, 5.4.1, 5.4.1.1, 5.4.2, 5.4.3
Feedback submitted, thanks!